Using titanium to increase crop yields

There are many additives that can be used to enhance the yield of flowering crops. Some have been covered in this blog – like silicon – while others haven’t been mentioned here. Today we are going to talk about a rarely discussed additive that is infrequently used in plant culture these days: Titanium. I want to talk about this additive in light of a literature review that came up recently (April 2017) about the use of Titanium in crop production. The magazine where this review came from (Frontiers in Plant Science) is a magazine that often has good content in the field of innovative crop enhancing techniques.

Titanium use in plant culture is not new. From the early 1980s people started to experiment with titanium as techniques were developed in order to produce titanium chelates that could be used in foliar applications. Basically all reports of yield increases – that show wonderful increases up to even 95.3% in yields – come from a paper on the biological importance of titanium by Dr. István Pais in 1983 and then another publication in 1991 by the same person (here). Other authors have also showed increased yields (here and here) although in some cases in conjunction with other additives (like Si) with results often much less dramatic than the initial 1983 papers. Titanium nanoparticles have also been tested and their effect has mostly been negative with decreases in plant growth and often DNA damage. For this reason when using titanium you want to go with a soluble chelate and not nanoparticle sources.

Creating aqueous stable Ti is not a cake walk. There is currently only one product that carries water soluble Ti (called Tytanit) and as far as I can tell no other commercial products for the application of Ti exist at this moment. This tytanit product is most probably titanium ascorbate – the most popular chelate used – but other organic chelates, like Ti citrate, might be usable as well. Preparing Ti ascorbate is not so easy to get as well – you cannot just buy it on ebay/alibaba as it’s not stable as a solid – so you need to prepare it from scratch. Titanium chemistry in solution is sadly very complicated.

However there is probably a route to the easy preparation of such complexes using a simple method involving titanium dioxide and ascorbic acid. We know from dissolution studies of titanium dioxide that it can be dissolved significantly by ascorbic acid but the final concentration of these solutions is not very high with a final concentration of around 0.025M of Ti possible in solution using this method, with a surrounding concentration of 0.15M of ascorbic acid. More acid does not help dissolve more titanium dioxide as this seems to be the solubility limit of the titanium complex. This gives you around 1.2g/L of Ti which you need to dissolve 500-1000x to arrive at the recommended application rate of 1-2 ppm. This will give a final ascorbic acid concentration of 26ppm which is acceptable as an additive as well.

Obviously there are some further formulation steps necessary to get the above to work correctly but this outlines the basics to develop a concentrated titanium ascorbate product that can be used for the creation of a Titanium supplement. Industrally this can be achieved much more efficiently with the use of titanyl sulfate which is a readily soluble and easy to get industrially – but hard to get for your home – form of titanium. You can see this patent for examples of how a fertilizer using titanyl sulfate can be prepared.

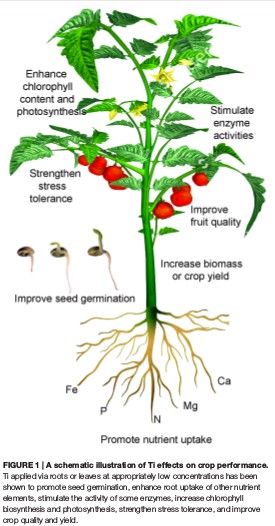
Evidence about titanium – applied as titanium ascorbate in a foliar spray – being positive for crops is significant. Various positive effects have been shown across a significant variety of plants across several different plant types – tomatoes, beans, peppers – by different authors. The effect on yields is not so clear – probably in reality not as large as shown in the original studies, but probably significant enough to warrant further studying. The development of low-cost processes for the manufacturing of titanium fertilizers will further enhance their use and increase our knowledge about their true capabilities. More studies with ascorbic/ascorbate controls will also show us clear evidence of whether we are seeing effects related with the ascorbate or the actual Ti chelate.


Phosphorous toxicity and concentration in higher plants

If you search the web for symptoms of nutrient toxicities you will often find clear pictures and descriptions for most elements. Feed a plant too much nitrogen and it will grow leggy and weak, with dark leaves and long stems, feed it too much boron and you will see yellowing and tissue necrosis. However you will struggle to find descriptions for toxicity symptoms for potassium (K) or phosphorous (P). Is there really no P or K toxicity? Why are they no pictures or clear ideas of how these problems look? Today I am going to talk a bit about P toxicity and why it’s so difficult to reach levels where plants react very negatively to ions from the phosphate family. Images posted were taken from articles cited within this post.

You will often find websites that talk about P toxicity as saying that it is rare or that what it causes is mainly problems with other elements. In general increases in P concentration can cause problems with other elements particularly because the solubility of dihydrogen phosphate salts (H2PO4), salts that form with the ionic form of phosphate that’s mainly present around the pH values used in hydroponics (5.5-6.5) can be very insoluble. You will struggle to find solubility values for heavy metal dihydrogen phosphates, but Fe, Zn and Cu dihydrogen phosphates can be reasonably presumed to be poorly soluble. However calcium dihydrogen phosphate has a solubility of 20g/L at 25°C and is therefore very soluble, so no problems with Ca due to having a lot of phosphorous (this salt is also known as mono calcium phosphate).

The solubility of Ca dihydrogen phosphate is in fact very important because rock phosphate – tricalcium phosphate – is one of the main sources of phosphorous in soil and it dissolves to form protonated phosphate species at the pH usually created around plant roots. This means that many plants evolved with very large occasional concentrations of dihydrogen phosphate around them and therefore they generated mechanisms to down-regulate the uptake of phosphorous from really high concentrations.

There is strong evidence about the above. In fact plants that evolved in phosphorous-poor soils did not evolve mechanisms for down-regulation and do exhibit P toxicity even at moderate concentrations of this element. A few plants native to Australia exhibit this behavior, you can read more about this here. Due to this fact many plants can be cultured in media that is amended with fertilizers that generate large local concentrations of phosphorous when watered without showing any strongly negative effects. Note however that plants will eliminate these down-regulation mechanisms significantly if they are in a P deficient media and if you feed them P rapidly you can cause P toxicity just because the plant couldn’t react fast enough to the large increase in P concentration. See for example this study using P deficient Barley which accumulated toxic levels of P upon supplementation although this did not happen when the plants were constantly exposed to high P levels.

In hydroponics we do see excess of P manifest itself as deficiencies of other elements because of the solubility issues for heavy metal acid phosphates mentioned above. Several studies show the strong link between P concentration and the availability of some micro-elements. For example this paper shows the relationship between P and Zn and how the relationship corresponds with Zn phosphate precipitation in the roots. However if heavy metals are properly chelated we in fact don’t see these problems. I have made experiments with plants – basil and mint – cultivated in 600 ppm of P where I have failed to see any significant problems although I have failed to find any papers that describe experiments under such extreme P concentrations.

Is more P always better then? Studies in tomatoes show better responses to salinity at higher P concentrations (for example here). Although the highest concentration tested here is 61 ppm (2mM) which is higher than but still close to what is generally used in hydroponic culture of tomato plants (30-50 ppm). Tabasco pepper has also been found to grow better under higher P concentrations (see here). A study varying P concentration in hob marjoram found lower essential oil concentrations at higher P levels, although these levels are around 60 ppm as well. Lettuce on the other hand shows increases of sesquiterpene lactones at high P levels (see here). There are a few publications about P toxicity in higher plants – notably this one about tomatoes – where problems caused by P are generally associated with the previously mentioned micronutrient issues and P concentrations in leaf tissue above 1%.

In summary P toxicity depends heavily on plant type and its ability to regulate P uptake, it is also most likely heavily dependent on micronutrient concentration and the strength and stability of the chelating agents used to prevent the precipitation of heavy metal phosphates. There are no studies I could find with P under very high concentrations (>=20mM) using chelated heavy metal sources so this is an interesting topic for research for anyone interested in exploring the limits of P uptake.


A simple Arduino based sensor monitoring platform for Hydroponics

Last time I posted about automation I talked about how I use an Arduino to automate the monitoring and management of my home hydroponic system. Today I want to talk about how you can build an Arduino based station to monitor the most important variables of your hydroponic crop without having to solder anything, use complicated bread board setups or learn to how to do any coding. I will walk you through some of the steps to build the system, talk about the parts you need and show you the code you need to run to have this setup work.

A basic sensor monitoring application for hydroponics should be able to get the most critical information needed to grow a crop successfully. The basic variables you would want to monitor to achieve this goal would be: temperature, humidity, carbon dioxide concentration, pH and electrical conductivity. An Arduino micro-controller can help you achieve all these goals at a reduced cost when compared with commercially available monitoring solutions of the same quality.

The list above contains all the pieces you need to get this to work. This includes the Arduino plus an LCD display that we will use to be able to read the information we obtain from the sensors. I have included links to the pieces at the dfrobot site (one of my favorite sources for DIY electronics) but you can definitely get them elsewhere if you prefer. The pH sensor included here is of industrial quality while the EC sensor has a lower quality level. However I have been able to use both for extended periods of time without anything else than a calibration around once every 2 months. If you want you can also purchase an industrial quality EC probe if you find the prove from the included Gravity kit to be insufficient for your needs.

The cool thing about this setup is that the LCD screen already contains all the connections we need for the sensors. The bottom part contains numbered analog inputs while the left part contains numbered digital inputs. In this setup we have two digital sensors – the DHT22 humidity/temperature sensor and the solution temperature sensor that comes with the EC sensor – and three analog sensors, which are pH, EC and CO2. I have put some text on the image to show you exactly where you should connect the sensors according to the code, make sure the orders of the colors on the wires match the colors on the connector in the LCD screen. The Arduino code contains some defines with the pins for each sensor so you can just change those numbers if you want to connect the sensors in different places.

//Libraries
#include <DHT.h>;
#include <U8glib.h>
#include <stdio.h>
#include <OneWire.h>
#include <Wire.h>
#include <Arduino.h>
#include <Adafruit_Sensor.h>

//PINS
#define DHT_PIN        5          // DHT pin
#define DHTTYPE        DHT22      // DHT 22  (AM2302)
#define PH_PIN         2          //pH meter pin
#define CO2_PIN        3          //ORP meter pin
#define EC_PIN         1          //EC meter pin
#define DS18B20_PIN    6          //EC solution temperature pin

// AVERAGING VALUES
#define MEDIAN_SAMPLE 8
#define MEASUREMENTS_TAKEN 100

// EC - solution temperature variables
#define StartConvert 0
#define ReadTemperature 1

// EC values // CHANGE THESE PARAMETERS FOR EC PROBE CALIBRATION
#define EC_PARAM_A 0.00754256

//pH values // CHANGE THESE PARAMETERS FOR PH PROBE CALIBRATION
#define PH_PARAM_A 1.0
#define PH_PARAM_B 0.0

#define XCOL_SET 55
#define XCOL_SET2 65
#define XCOL_SET_UNITS 85

//--------------------------

DHT dht(DHT_PIN, DHTTYPE); 
U8GLIB_NHD_C12864 u8g(13, 11, 10, 9, 8); 
unsigned long int avgValue;  
float b, phValue;
int buf[MEASUREMENTS_TAKEN],tmp;
int chk;
float hum;  
float temp;
unsigned int AnalogAverage = 0,averageVoltage=0; 
float solution_temp,ECcurrent; 
unsigned int levelAverage;
float co2;
OneWire ds(DS18B20_PIN); 

//--------------------------

void draw() {
  u8g.setFont(u8g_font_04b_03); 
  
  u8g.drawStr( 0,11,"Temp:");
  u8g.setPrintPos(XCOL_SET,11);
  u8g.print(temp); 
  u8g.drawStr( XCOL_SET_UNITS, 11,"C" ); 
  
  u8g.drawStr(0,21,"Humidity:");
  u8g.setPrintPos(XCOL_SET,21);
  u8g.print(hum);
  u8g.drawStr( XCOL_SET_UNITS,21,"%" );
  
  u8g.drawStr(0,31,"pH:");
  u8g.setPrintPos(XCOL_SET,31);
  u8g.print(phValue);
  
  u8g.drawStr(0,41,"EC:");
  u8g.setPrintPos(XCOL_SET,41);
  u8g.print(ECcurrent);
  u8g.drawStr( XCOL_SET_UNITS,41,"mS/cm" );
  
  u8g.drawStr(0,51,"Sol.Temp:");
  u8g.setPrintPos(XCOL_SET,51);
  u8g.print(solution_temp);
  u8g.drawStr( XCOL_SET_UNITS,51,"C" );
  
  u8g.drawStr(0,61,"CO2:");
  u8g.setPrintPos(XCOL_SET,61);
  u8g.print(co2);
  u8g.drawStr( XCOL_SET_UNITS,61,"ppm" );
  
}

float TempProcess(bool ch)
{
  static byte data[12];
  static byte addr[8];
  static float TemperatureSum;
  if(!ch){
          if ( !ds.search(addr)) {
              ds.reset_search();
              return 0;
          }      
          if ( OneWire::crc8( addr, 7) != addr[7]) {
              return 0;
          }        
          if ( addr[0] != 0x10 && addr[0] != 0x28) {
              return 0;
          }      
          ds.reset();
          ds.select(addr);
          ds.write(0x44,1); 
  }
  else{  
          byte present = ds.reset();
          ds.select(addr);    
          ds.write(0xBE);           
          for (int i = 0; i < 9; i++) { 
            data[i] = ds.read();
          }         
          ds.reset_search();           
          byte MSB = data[1];
          byte LSB = data[0];        
          float tempRead = ((MSB << 8) | LSB); 
          TemperatureSum = tempRead / 16;
    }
          return TemperatureSum;  
}

void calculateAnalogAverage(int pin){
 AnalogAverage = 0;
  
  for(int i=0;i<MEASUREMENTS_TAKEN;i++)       
  { 
    buf[i]=analogRead(pin);
    delay(10);
  }
  for(int i=0;i<MEASUREMENTS_TAKEN-1;i++)        
  {
    for(int j=i+1;j<MEASUREMENTS_TAKEN;j++)
    {
      if(buf[i]>buf[j])
      {
        tmp=buf[i];
        buf[i]=buf[j];
        buf[j]=tmp;
      }
    }
  }
  
  avgValue=0;
  for(int i=(MEASUREMENTS_TAKEN/2)-(MEDIAN_SAMPLE/2);i<(MEASUREMENTS_TAKEN/2)+(MEDIAN_SAMPLE/2);i++){                     
    avgValue+=buf[i];
  }
    
  AnalogAverage = avgValue/MEDIAN_SAMPLE ; 
}

void read_pH(){
  
  calculateAnalogAverage(PH_PIN);
  phValue=(float)AnalogAverage*5.0/1024; 
  phValue=PH_PARAM_A*phValue+PH_PARAM_B;    
}

void read_EC(){
  
  calculateAnalogAverage(EC_PIN);
  
  solution_temp = TempProcess(ReadTemperature);  
  TempProcess(StartConvert);                   
  
  averageVoltage=AnalogAverage*(float)5000/1024;
  float TempCoefficient=1.0+0.0185*(solution_temp-25.0);   
  float CoefficientVolatge=(float)averageVoltage*TempCoefficient;   
  
  ECcurrent=EC_PARAM_A*CoefficientVolatge;     
}

void read_CO2(){
  float voltage;
  float voltage_difference;
  calculateAnalogAverage(CO2_PIN); 
  voltage = AnalogAverage*(5000/1024.0); 
  
  if(voltage == 0)
  {
    co2=-100.0;
  }
  else if(voltage < 400)
  {
    co2=0.0;
  }
  else
  {
    voltage_difference=voltage-400;
    co2=voltage_difference*50.0/16.0;
  }
}

void setup()
{
    pinMode(13,OUTPUT);  
    Serial.begin(9600);
    
    dht.begin();
    u8g.setContrast(0);
    u8g.setRot180();
    TempProcess(StartConvert);   
}

void loop()
{
 
  digitalWrite(13, HIGH);       
  delay(800);
  digitalWrite(13, LOW);   
    
  hum = dht.readHumidity();
  temp= dht.readTemperature(); 
  read_pH();
  read_EC();
  read_CO2();

  u8g.firstPage();
    do  {
      draw();
    } 
      while( u8g.nextPage() );          
      
}

After you connect the sensors you can then upload the code above using the Arduino IDE to your Arduino via USB. You will need to install the following Arduino libraries to get it to compile and upload:

After you upload this to your Arduino it should start and show you a screen with the temperature, humidity, pH, EC and carbon dioxide readings. The carbon dioxide concentration might show as -100 in the beginning, which simply means that the sensor is heating up (it requires a few minutes before it can start giving readings).

It is also worth noting that you should calibrate your pH sensor. To do this you should read the pH of a 7.0 buffer (M7) – record the value you get – and then repeat the process with a pH 4.0 buffer (M4). You can then change the PH_PARAM_A and PH_PARAM_B values in the code (right at the beginning) to make the sensor match your measurements. The PH_PARAM_A parameter should be equal to 3/(M7-M4) while PH_PARAM_B should be 7-M7*PH_PARAM_A. If you ever need to recalibrate set PH_PARAM_A to 1 and PH_PARAM_B to 0 and repeat the process. For the EC sensor you should perform a calibration using the 1.412 mS/cm solution that comes with the sensor and then change EC_PARAM_A so that your sensor matches this reading (1.412/(MEC/0.00754256)).

With this new monitoring station you should now have a powerful tool to monitor your hydroponic system and make sure everything is where you want it. Of course making the arduino intereact with a computer to record these values and then implementing control mechanisms using fans, peristaltic pumps, water pumps, humidifiers/dehumidifiers and other appliances is the next step in complexity.