Calibrating a capacitive moisture/water content sensor for hydroponics
As I’ve mentioned multiple times in my blog, moisture sensing is one of the most important measurements in a hydroponic crop that uses a significant amount of media. It allows you to properly time irrigations and avoid over or under watering your plants. Capacitive sensors are the lowest cost initial approach to adequate moisture monitoring of your media. In this post, we are going to learn how to use an Arduino with a gravity shield and a low-cost capacitive moisture sensor in order to accurately monitor the water saturation of our media.
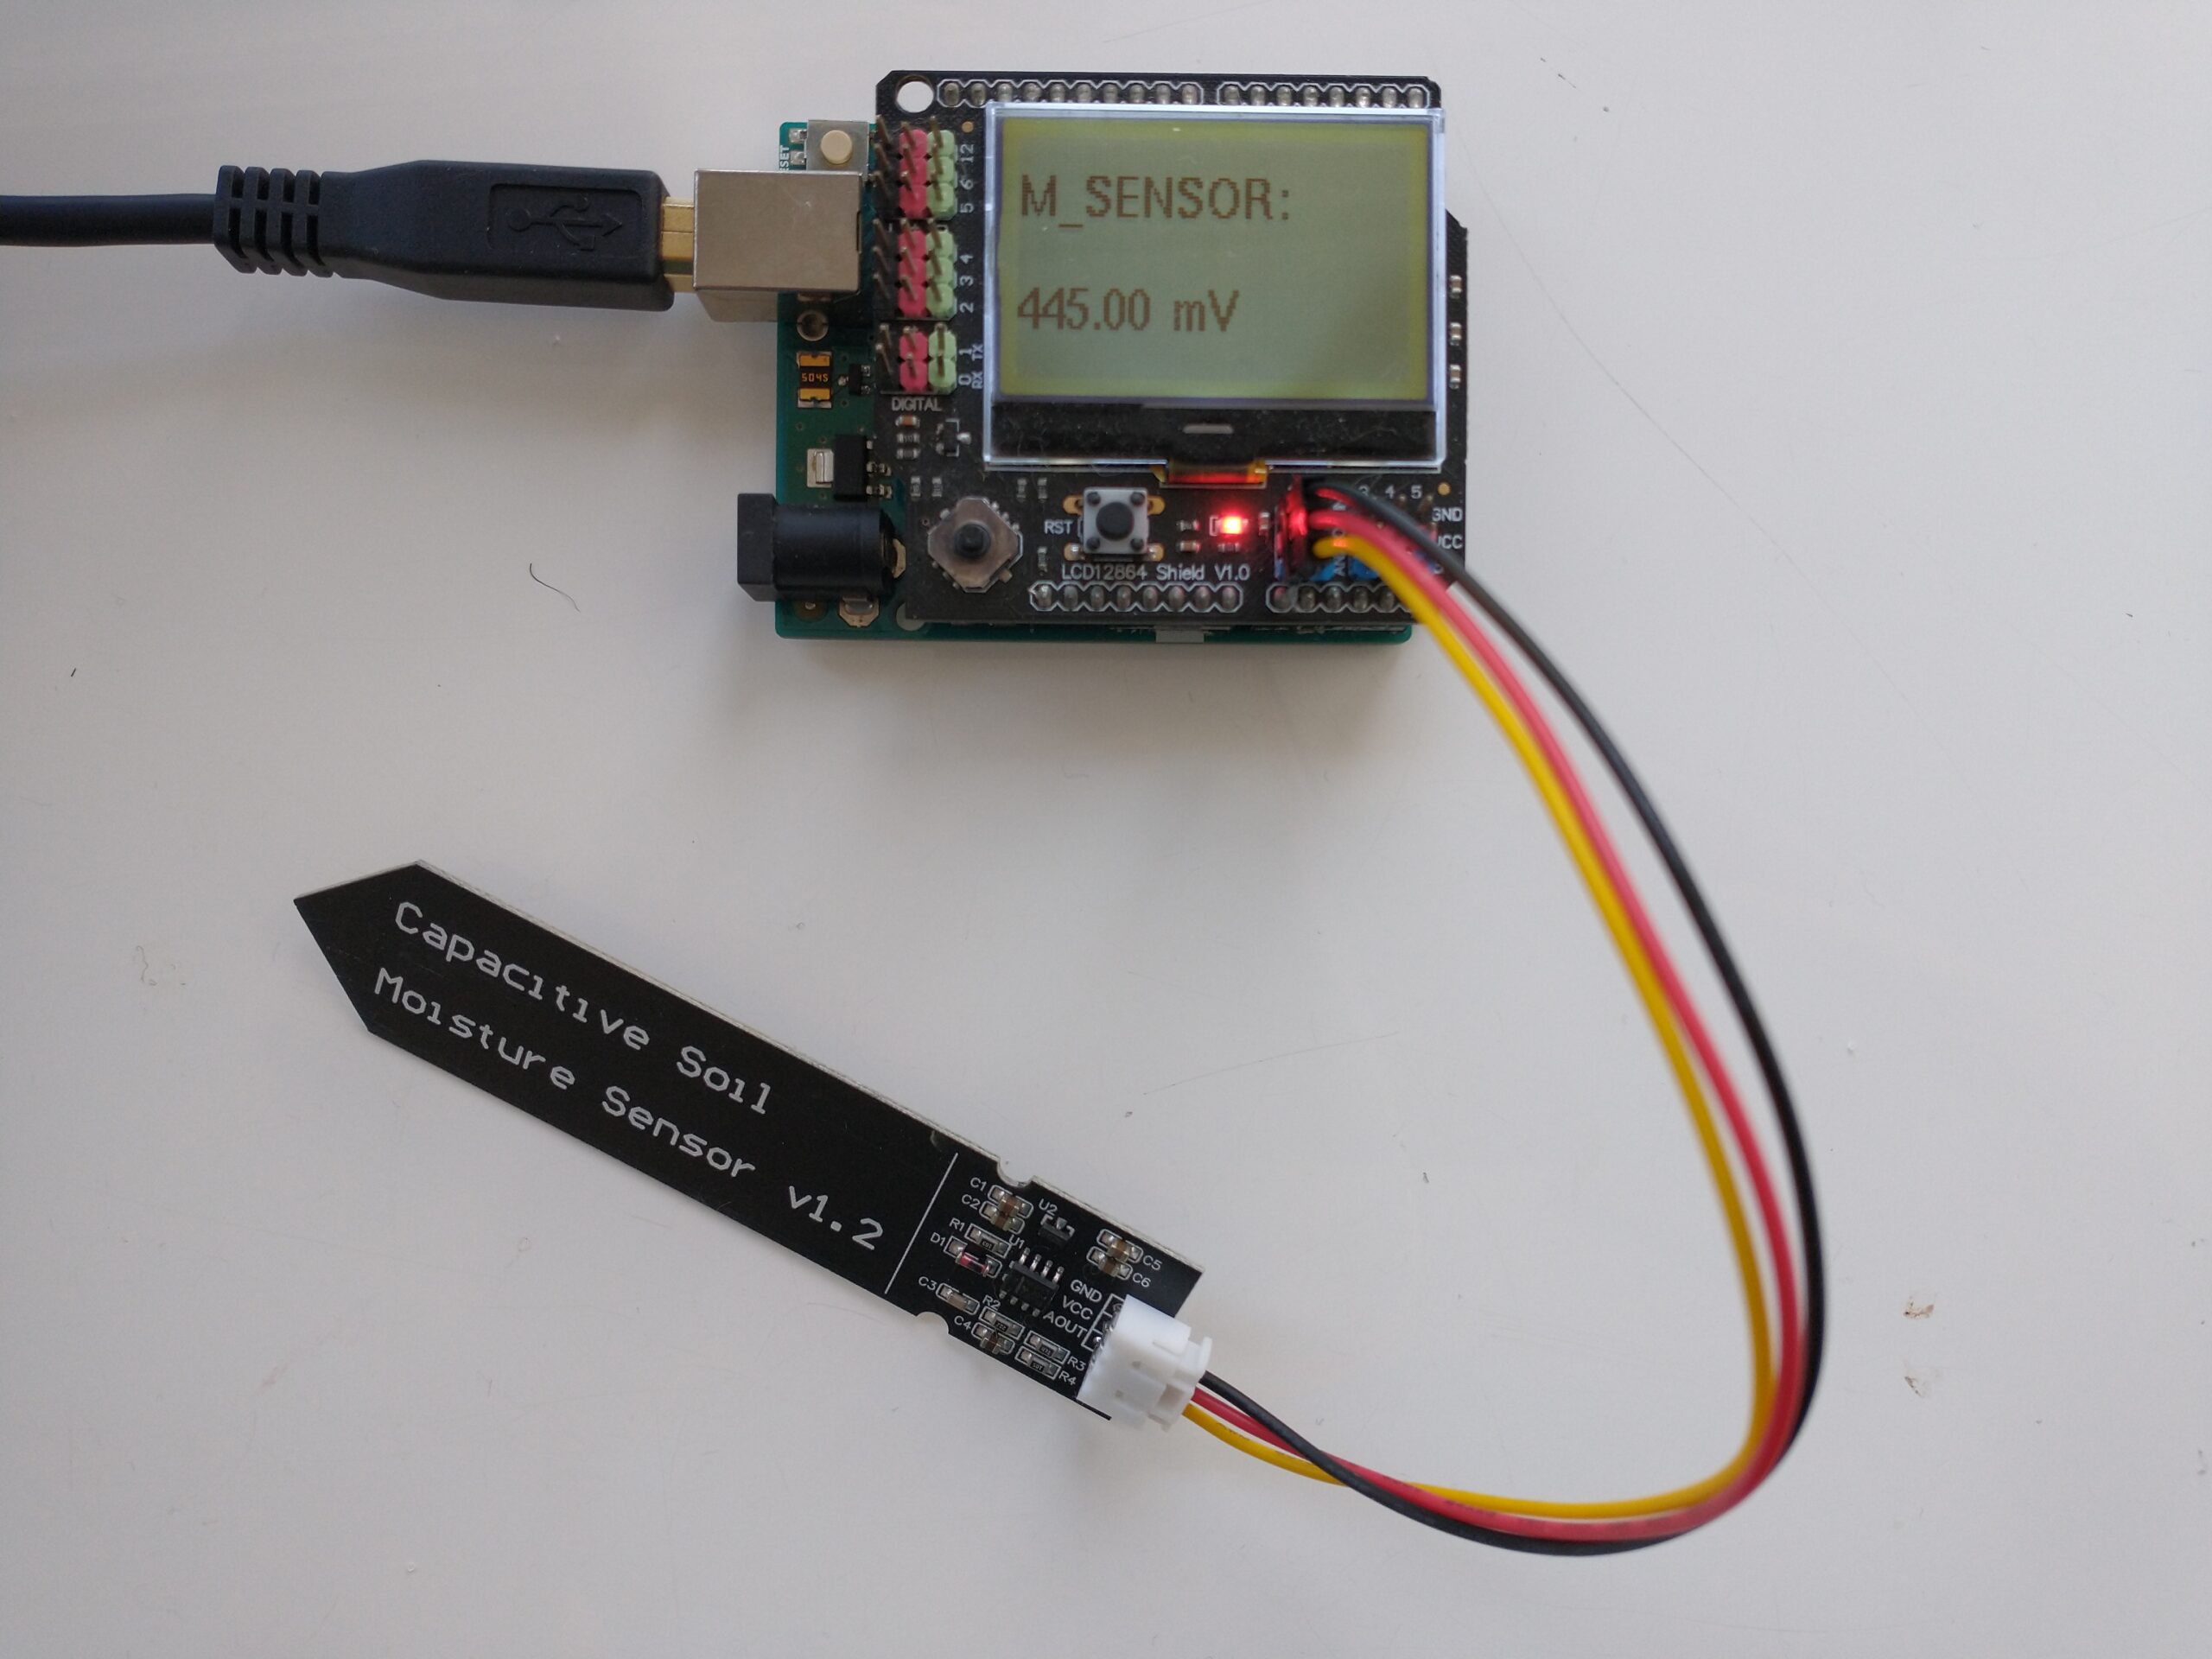
An analogue capacitive moisture sensor like this one does not expose any metallic parts to the media and can be used for the monitoring of moisture content. This sensor is powered by 3.5-5V and gives you a voltage signal that is proportional to the dielectric constant of the media it is in. As the dielectric constant of media changes with the presence of water, so does the signal of the sensor. However, no specific voltage corresponds to a specific water content measurement by definition, so we need to calibrate the sensor in order to interpret the voltage values we read from it. In order to get readings from this sensor, I use an Arduino UNO, the above-linked capacitive sensor, and an LCD shield from dfrobot that I can use to easily get the device readings. The arduino code used for this device is also shared below.
#include <U8glib.h>

#define XCOL_SET 0
#define XCOL_SET_UNITS 50

U8GLIB_NHD_C12864 u8g(13, 11, 10, 9, 8);
float capacitance;

void draw() {

  u8g.setFont(u8g_font_helvB10);

  u8g.drawStr(0,21,"M_SENSOR:");
  u8g.setPrintPos(XCOL_SET,51);
  u8g.print(capacitance);
  u8g.drawStr( XCOL_SET_UNITS,51,"mV" );

}

void setup() {
  pinMode(LED_BUILTIN, OUTPUT);
  pinMode(4, OUTPUT);
  Serial.begin(115200);
  analogReference(DEFAULT);
  Serial.println("MOISTURE");

  u8g.setContrast(0);
  u8g.setRot180();
}

void loop() {

  draw();
  capacitance = analogRead(1);
  Serial.println(capacitance);

  u8g.firstPage();
    do  {
      draw();
    }
      while( u8g.nextPage() );

  delay(1000);

}
The calibration of a moisture sensor usually requires the creation of what soil scientists call a “water retention” curve, which is a curve where you plot the sensor’s signal as a function of a fixed volume or weight of water added to the media. However, this approach involves the use of many different containers and the addition of water to the media followed by oven drying steps in order to accurately determine how much moisture was actually in the media for every measurement carried out.
In order to do this procedure in an easier manner, losing as little accuracy as possible, I have created a calibration procedure that makes use of natural drying and only requires one single oven drying step. The procedure is as follows:
- Heat the media that will be used for an experiment in an oven at 110°C (this drives out all water).
- Wait for the media to cool to room temperature.
- Fill the container that will be used for the test (this can plastic but has to have holes at the bottom). Put the sensor in the media, make sure the sensor is driven into the media until the top line is reached.
- Take a reading, this is the “completely dry” media reading.
- Disconnect the sensor from the Arduino.
- Weigh the container+media+sensor. This will be the “dry weight”.
- Take the sensor out.
- Add water to the media until there is ample runoff coming out of the bottom.
- Wait until no more runoff comes off.
- Put the sensor in the media, making sure you drive it in until the top line is reached. The sensor won’t be taken out for the remainder of the experiment.
- Connect the sensor and take a reading. Take note of this value.
- Disconnect the sensor.
- Weigh the container+media+sensor. Take note of this value. The first reading you take is the “max saturation” weight.
- Repeat steps 11 to 13 every 1-6 hours (time is not very important as long as you gather enough data points) until you reach close to the dry weight. This can take several days depending on the media used. The more points you measure, the more accurate your curve will be.
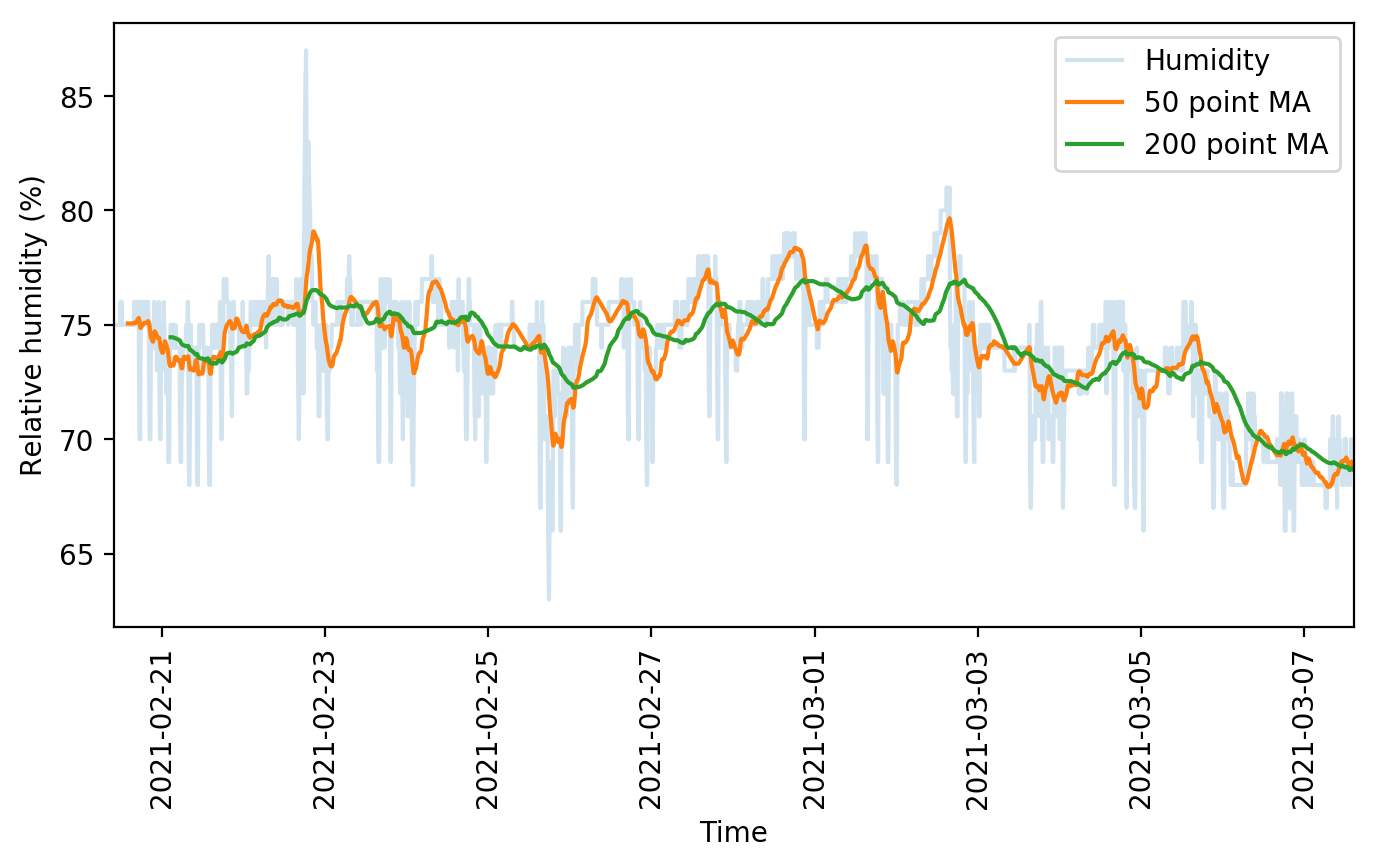
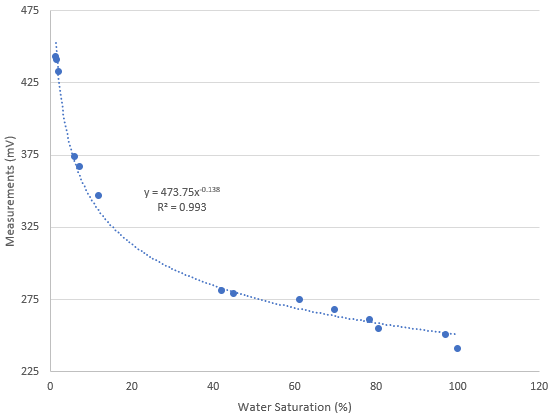
After carrying out this procedure, you can create a curve like the one shown below. You can use the difference between each weight and the dry weight divided by the difference between the weight at max saturation and the dry weight in order to calculate the water saturation percentage. As you can see, the curves for these sensors are fairly linear in the 40-100% moisture range for the media I tested, while below 40% the regime changes and the measurement increases exponentially until it reached the “dry weight” sensor value. The entire curve can be described with a power-law equation. This behavior will not be the same for all media tested, reason why it’s very important for you to calibrate the sensor for the specific media you want to use.
Once you have your sensor calibrated you can know what a measurement in mV implies in terms of water saturation for a given media type. This allows you to time your irrigations at a given water saturation % effectively. Which water saturation percentage might be better, depends on the properties of your media and how the water potential changes as a function of the water saturation. However, this allows you to experiment with irrigations at different water saturation % values and figure out exactly where you need to water so that your plants are not under or overwatered.
It is also worth noting that the above sensor is probably not rugged enough for use in a hydroponic setup without a bit more hardening. In order to use these sensors in practical applications, you should apply conformal coating to the electronics at the top of the sensor and then use shrink tubing in order to fully protect these electronics from the elements.