A simple Arduino based sensor monitoring platform for Hydroponics
Last time I posted about automation I talked about how I use an Arduino to automate the monitoring and management of my home hydroponic system. Today I want to talk about how you can build an Arduino based station to monitor the most important variables of your hydroponic crop without having to solder anything, use complicated bread board setups or learn to how to do any coding. I will walk you through some of the steps to build the system, talk about the parts you need and show you the code you need to run to have this setup work.
–
–
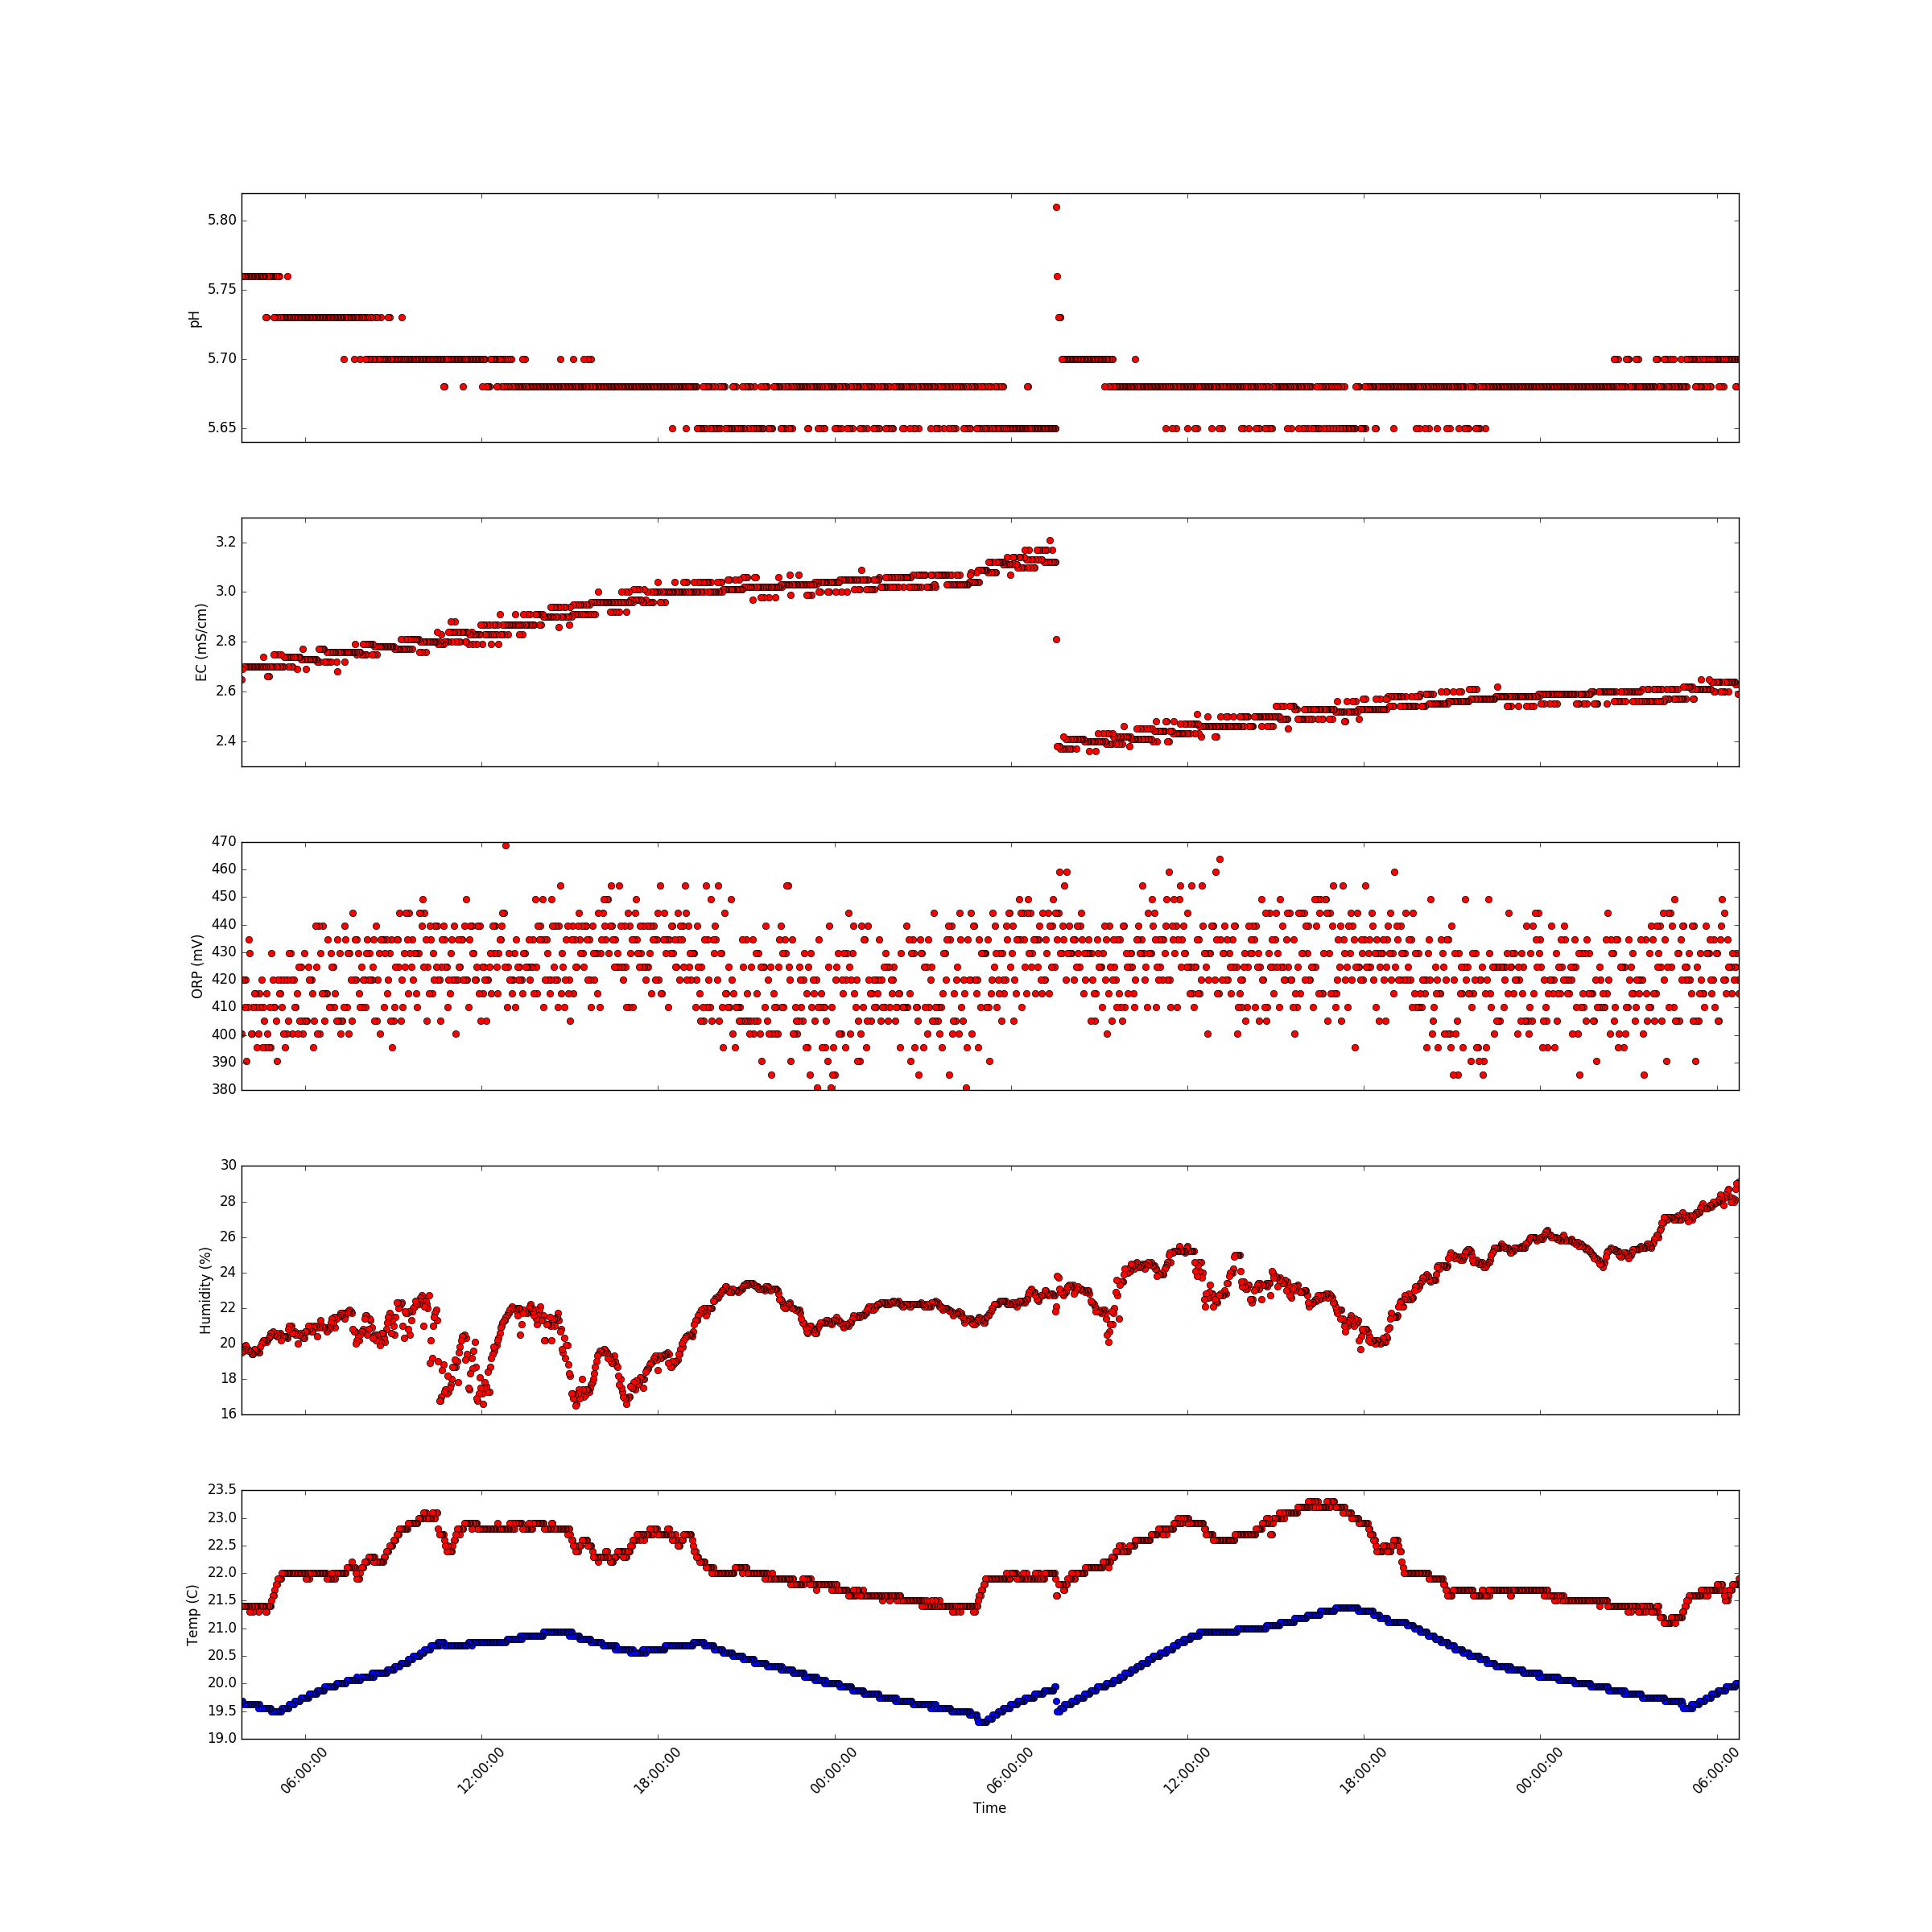
A basic sensor monitoring application for hydroponics should be able to get the most critical information needed to grow a crop successfully. The basic variables you would want to monitor to achieve this goal would be: temperature, humidity, carbon dioxide concentration, pH and electrical conductivity. An Arduino micro-controller can help you achieve all these goals at a reduced cost when compared with commercially available monitoring solutions of the same quality.
–
- Arduino UNO R3 – 23.90 USD
- LCD 12864 screen shield – 24.05 USD
- DHT22 temperature and humidity sensor – 9.50 USD
- Gravity pH sensor – 56.95 USD
- Gravity EC sensor – 69.90 USD
- Gravity CO2 sensor – 58.00 USD
–
The list above contains all the pieces you need to get this to work. This includes the Arduino plus an LCD display that we will use to be able to read the information we obtain from the sensors. I have included links to the pieces at the dfrobot site (one of my favorite sources for DIY electronics) but you can definitely get them elsewhere if you prefer. The pH sensor included here is of industrial quality while the EC sensor has a lower quality level. However I have been able to use both for extended periods of time without anything else than a calibration around once every 2 months. If you want you can also purchase an industrial quality EC probe if you find the prove from the included Gravity kit to be insufficient for your needs.
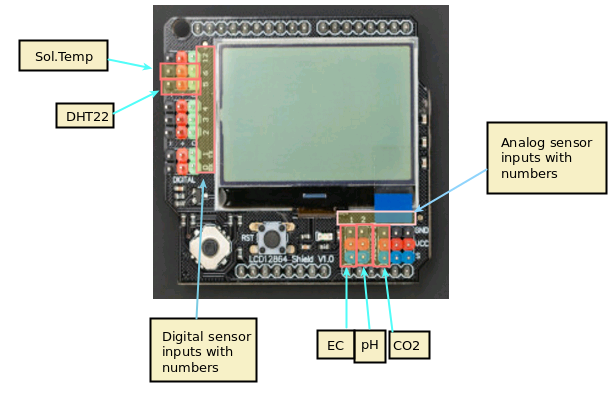
The cool thing about this setup is that the LCD screen already contains all the connections we need for the sensors. The bottom part contains numbered analog inputs while the left part contains numbered digital inputs. In this setup we have two digital sensors – the DHT22 humidity/temperature sensor and the solution temperature sensor that comes with the EC sensor – and three analog sensors, which are pH, EC and CO2. I have put some text on the image to show you exactly where you should connect the sensors according to the code, make sure the orders of the colors on the wires match the colors on the connector in the LCD screen. The Arduino code contains some defines with the pins for each sensor so you can just change those numbers if you want to connect the sensors in different places.
–
//Libraries
#include <DHT.h>;
#include <U8glib.h>
#include <stdio.h>
#include <OneWire.h>
#include <Wire.h>
#include <Arduino.h>
#include <Adafruit_Sensor.h>

//PINS
#define DHT_PIN        5          // DHT pin
#define DHTTYPE        DHT22      // DHT 22  (AM2302)
#define PH_PIN         2          //pH meter pin
#define CO2_PIN        3          //ORP meter pin
#define EC_PIN         1          //EC meter pin
#define DS18B20_PIN    6          //EC solution temperature pin

// AVERAGING VALUES
#define MEDIAN_SAMPLE 8
#define MEASUREMENTS_TAKEN 100

// EC - solution temperature variables
#define StartConvert 0
#define ReadTemperature 1

// EC values // CHANGE THESE PARAMETERS FOR EC PROBE CALIBRATION
#define EC_PARAM_A 0.00754256

//pH values // CHANGE THESE PARAMETERS FOR PH PROBE CALIBRATION
#define PH_PARAM_A 1.0
#define PH_PARAM_B 0.0

#define XCOL_SET 55
#define XCOL_SET2 65
#define XCOL_SET_UNITS 85

//--------------------------

DHT dht(DHT_PIN, DHTTYPE);
U8GLIB_NHD_C12864 u8g(13, 11, 10, 9, 8);
unsigned long int avgValue;
float b, phValue;
int buf[MEASUREMENTS_TAKEN],tmp;
int chk;
float hum;
float temp;
unsigned int AnalogAverage = 0,averageVoltage=0;
float solution_temp,ECcurrent;
unsigned int levelAverage;
float co2;
OneWire ds(DS18B20_PIN);

//--------------------------

void draw() {
  u8g.setFont(u8g_font_04b_03);

  u8g.drawStr( 0,11,"Temp:");
  u8g.setPrintPos(XCOL_SET,11);
  u8g.print(temp);
  u8g.drawStr( XCOL_SET_UNITS, 11,"C" );

  u8g.drawStr(0,21,"Humidity:");
  u8g.setPrintPos(XCOL_SET,21);
  u8g.print(hum);
  u8g.drawStr( XCOL_SET_UNITS,21,"%" );

  u8g.drawStr(0,31,"pH:");
  u8g.setPrintPos(XCOL_SET,31);
  u8g.print(phValue);

  u8g.drawStr(0,41,"EC:");
  u8g.setPrintPos(XCOL_SET,41);
  u8g.print(ECcurrent);
  u8g.drawStr( XCOL_SET_UNITS,41,"mS/cm" );

  u8g.drawStr(0,51,"Sol.Temp:");
  u8g.setPrintPos(XCOL_SET,51);
  u8g.print(solution_temp);
  u8g.drawStr( XCOL_SET_UNITS,51,"C" );

  u8g.drawStr(0,61,"CO2:");
  u8g.setPrintPos(XCOL_SET,61);
  u8g.print(co2);
  u8g.drawStr( XCOL_SET_UNITS,61,"ppm" );

}

float TempProcess(bool ch)
{
  static byte data[12];
  static byte addr[8];
  static float TemperatureSum;
  if(!ch){
          if ( !ds.search(addr)) {
              ds.reset_search();
              return 0;
          }
          if ( OneWire::crc8( addr, 7) != addr[7]) {
              return 0;
          }
          if ( addr[0] != 0x10 && addr[0] != 0x28) {
              return 0;
          }
          ds.reset();
          ds.select(addr);
          ds.write(0x44,1);
  }
  else{
          byte present = ds.reset();
          ds.select(addr);
          ds.write(0xBE);
          for (int i = 0; i < 9; i++) {
            data[i] = ds.read();
          }
          ds.reset_search();
          byte MSB = data[1];
          byte LSB = data[0];
          float tempRead = ((MSB << 8) | LSB);
          TemperatureSum = tempRead / 16;
    }
          return TemperatureSum;
}

void calculateAnalogAverage(int pin){
 AnalogAverage = 0;

  for(int i=0;i<MEASUREMENTS_TAKEN;i++)
  {
    buf[i]=analogRead(pin);
    delay(10);
  }
  for(int i=0;i<MEASUREMENTS_TAKEN-1;i++)
  {
    for(int j=i+1;j<MEASUREMENTS_TAKEN;j++)
    {
      if(buf[i]>buf[j])
      {
        tmp=buf[i];
        buf[i]=buf[j];
        buf[j]=tmp;
      }
    }
  }

  avgValue=0;
  for(int i=(MEASUREMENTS_TAKEN/2)-(MEDIAN_SAMPLE/2);i<(MEASUREMENTS_TAKEN/2)+(MEDIAN_SAMPLE/2);i++){
    avgValue+=buf[i];
  }

  AnalogAverage = avgValue/MEDIAN_SAMPLE ;
}

void read_pH(){

  calculateAnalogAverage(PH_PIN);
  phValue=(float)AnalogAverage*5.0/1024;
  phValue=PH_PARAM_A*phValue+PH_PARAM_B;
}

void read_EC(){

  calculateAnalogAverage(EC_PIN);

  solution_temp = TempProcess(ReadTemperature);
  TempProcess(StartConvert);

  averageVoltage=AnalogAverage*(float)5000/1024;
  float TempCoefficient=1.0+0.0185*(solution_temp-25.0);
  float CoefficientVolatge=(float)averageVoltage*TempCoefficient;

  ECcurrent=EC_PARAM_A*CoefficientVolatge;
}

void read_CO2(){
  float voltage;
  float voltage_difference;
  calculateAnalogAverage(CO2_PIN);
  voltage = AnalogAverage*(5000/1024.0);

  if(voltage == 0)
  {
    co2=-100.0;
  }
  else if(voltage < 400)
  {
    co2=0.0;
  }
  else
  {
    voltage_difference=voltage-400;
    co2=voltage_difference*50.0/16.0;
  }
}

void setup()
{
    pinMode(13,OUTPUT);
    Serial.begin(9600);

    dht.begin();
    u8g.setContrast(0);
    u8g.setRot180();
    TempProcess(StartConvert);
}

void loop()
{

  digitalWrite(13, HIGH);
  delay(800);
  digitalWrite(13, LOW);

  hum = dht.readHumidity();
  temp= dht.readTemperature();
  read_pH();
  read_EC();
  read_CO2();

  u8g.firstPage();
    do  {
      draw();
    }
      while( u8g.nextPage() );

}
–
After you connect the sensors you can then upload the code above using the Arduino IDE to your Arduino via USB. You will need to install the following Arduino libraries to get it to compile and upload:
–
–
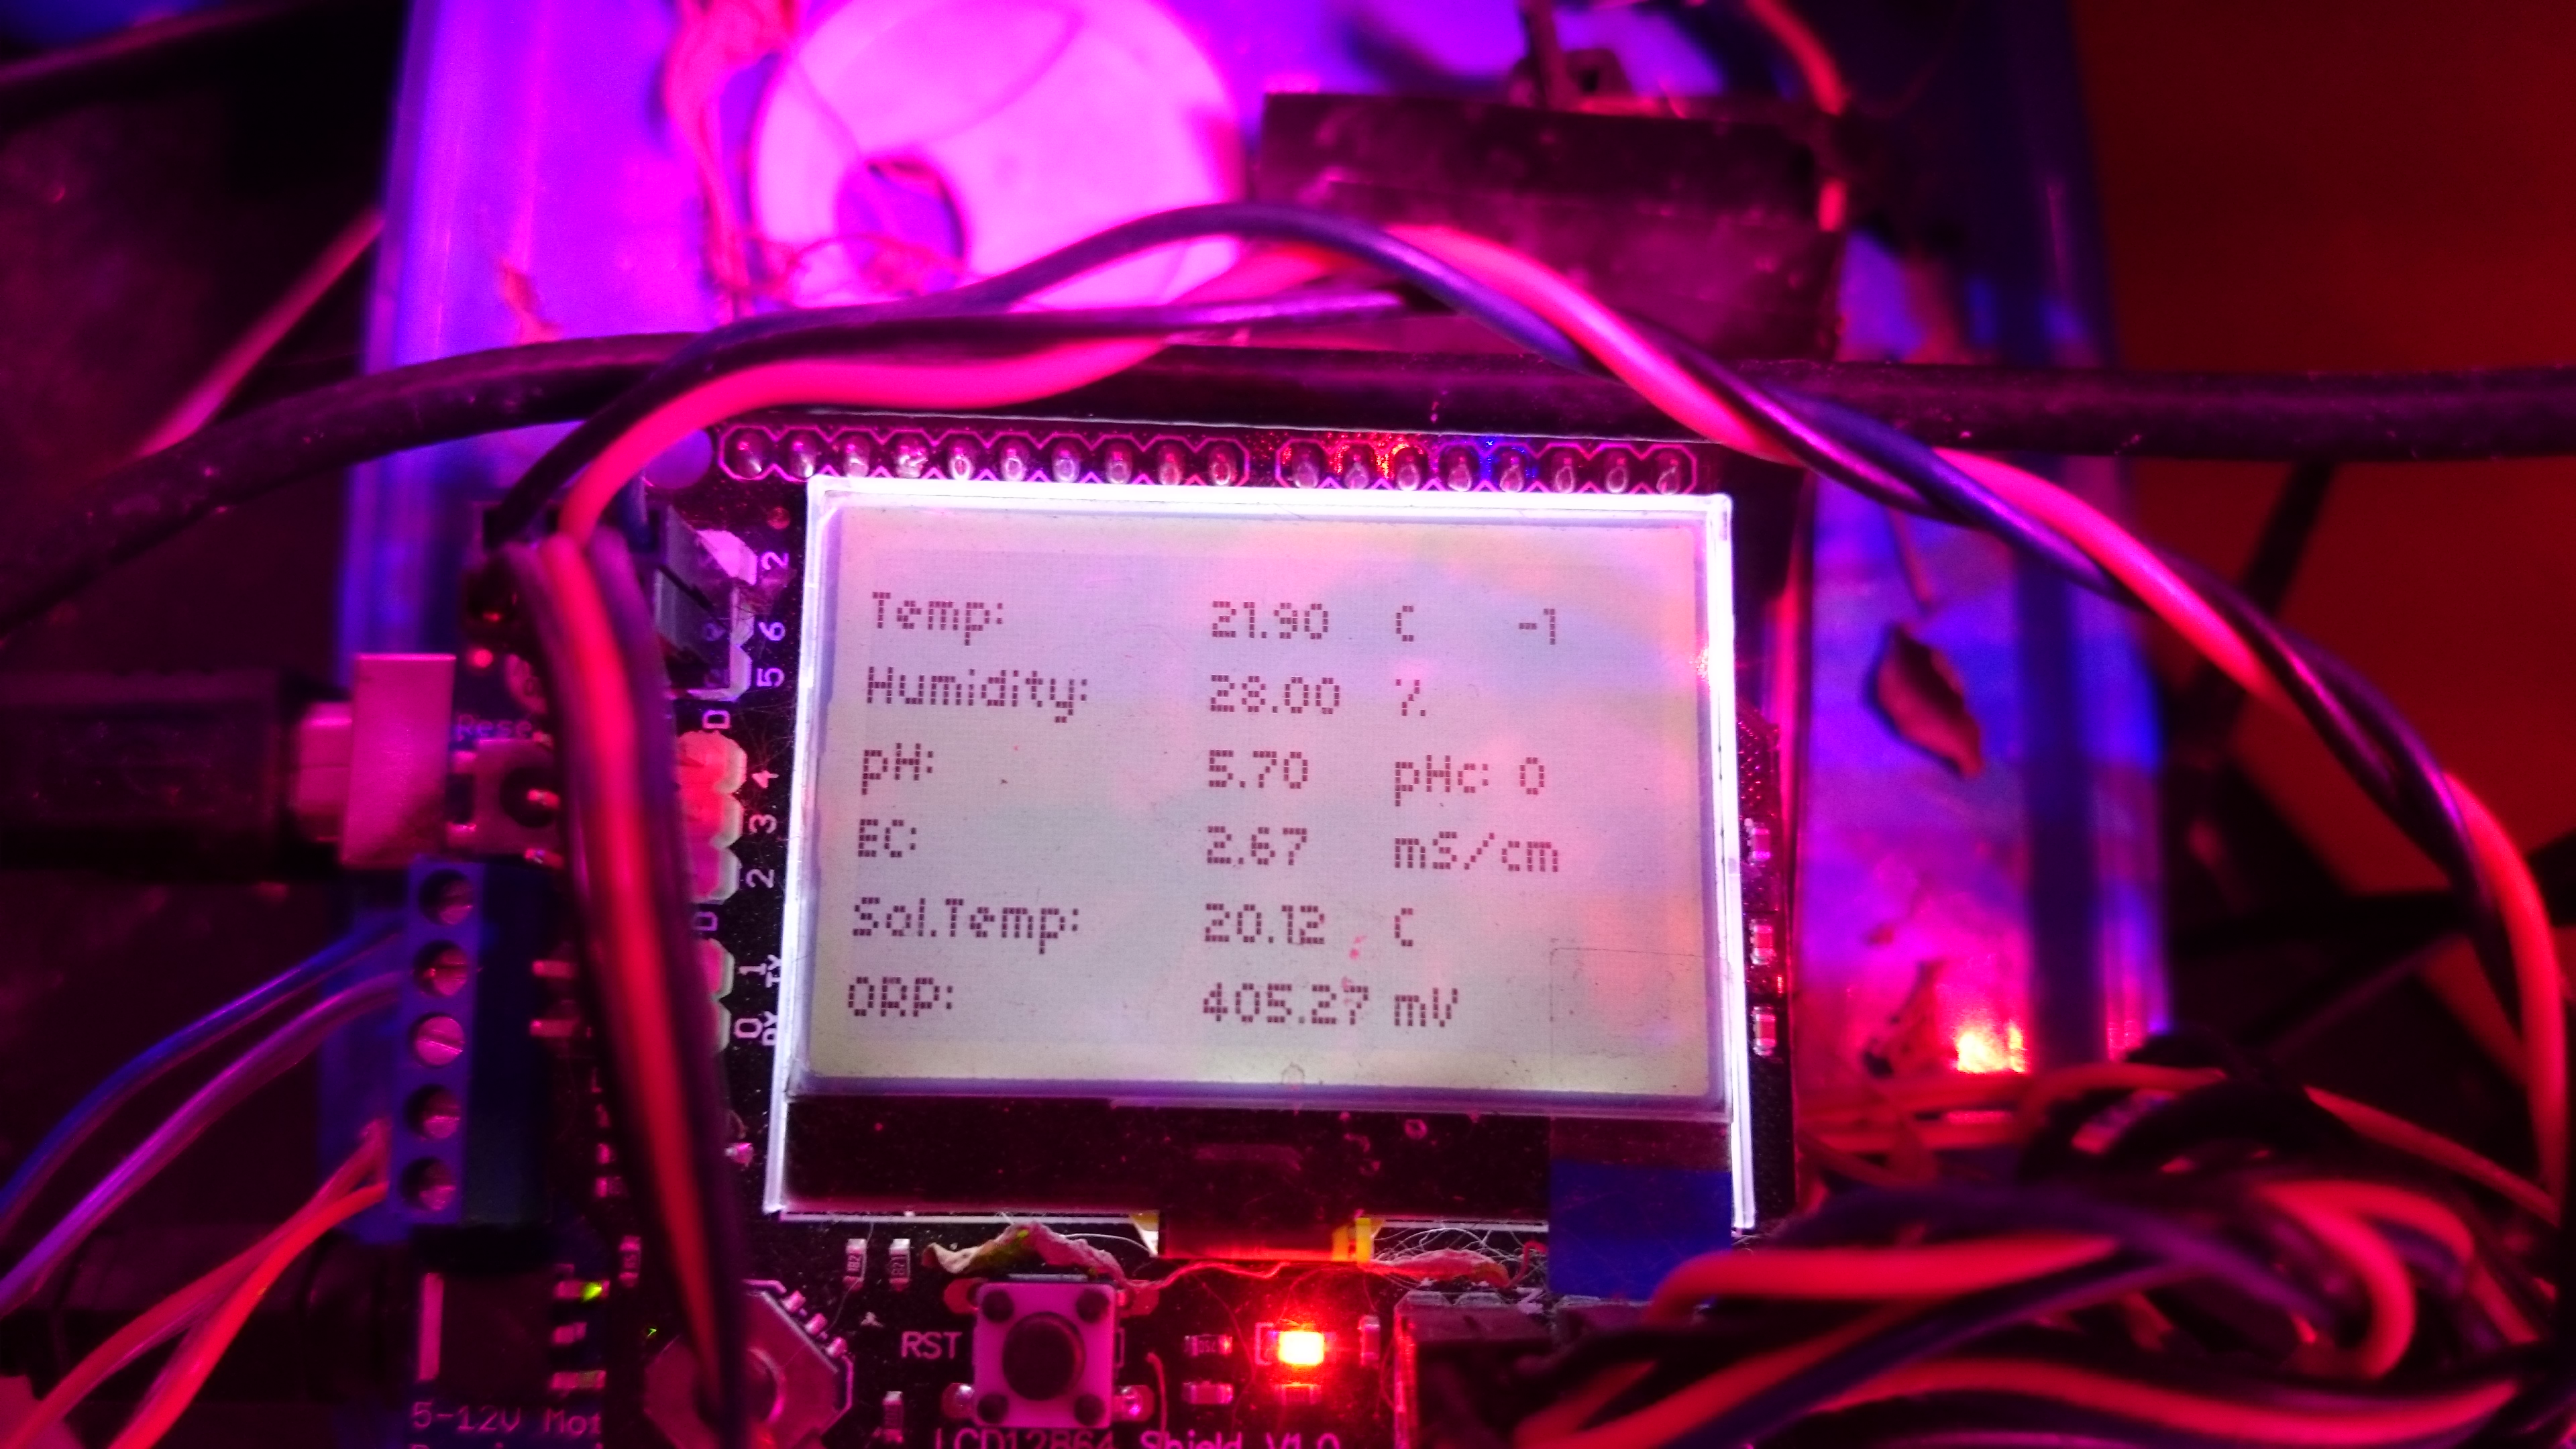
After you upload this to your Arduino it should start and show you a screen with the temperature, humidity, pH, EC and carbon dioxide readings. The carbon dioxide concentration might show as -100 in the beginning, which simply means that the sensor is heating up (it requires a few minutes before it can start giving readings).
It is also worth noting that you should calibrate your pH sensor. To do this you should read the pH of a 7.0 buffer (M7) – record the value you get – and then repeat the process with a pH 4.0 buffer (M4). You can then change the PH_PARAM_A and PH_PARAM_B values in the code (right at the beginning) to make the sensor match your measurements. The PH_PARAM_A parameter should be equal to 3/(M7-M4) while PH_PARAM_B should be 7-M7*PH_PARAM_A. If you ever need to recalibrate set PH_PARAM_A to 1 and PH_PARAM_B to 0 and repeat the process. For the EC sensor you should perform a calibration using the 1.412 mS/cm solution that comes with the sensor and then change EC_PARAM_A so that your sensor matches this reading (1.412/(MEC/0.00754256)).
With this new monitoring station you should now have a powerful tool to monitor your hydroponic system and make sure everything is where you want it. Of course making the arduino intereact with a computer to record these values and then implementing control mechanisms using fans, peristaltic pumps, water pumps, humidifiers/dehumidifiers and other appliances is the next step in complexity.