The Problems with Brix Analysis of Sap in Crops
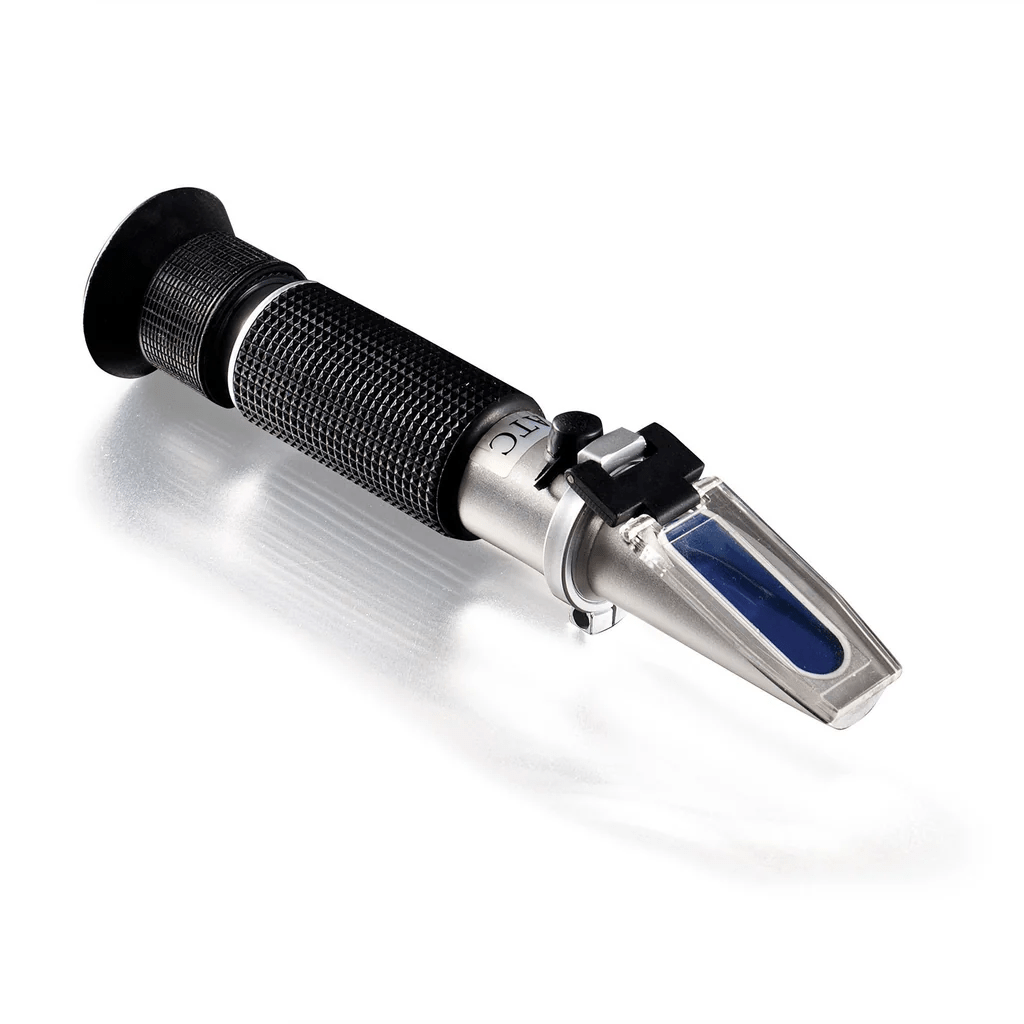
Brix analysis, the measurement of soluble solids in plant sap using a refractometer, has gained popularity as a quick field test for assessing plant health and crop quality. The method is appealingly simple: squeeze some sap from a leaf onto a refractometer, and within seconds you get a number that supposedly tells you how healthy your plant is. Many proponents claim that plants with high brix readings are more resistant to pests and diseases, while low readings indicate nutritional problems. However, when we examine the scientific literature surrounding brix measurements in plant sap, particularly for agronomically important crops in hydroponic or soilless systems, we find that this technique has substantial limitations that are often overlooked.
The Appeal and the Theory
The basic premise of brix analysis is straightforward. The refractometer measures the refractive index of a solution, which correlates with the concentration of dissolved solids (1). In plant sap, these dissolved solids include sugars, amino acids, proteins, minerals, and other organic compounds. The theory suggests that healthier plants with better nutrition will have higher sugar content from improved photosynthesis, leading to higher brix readings (2). While this sounds reasonable, the reality is far more complex.
Problem 1: Dramatic Diurnal Variation
One of the most significant issues with brix measurements is their extreme variability throughout the day. Plants accumulate sugars during photosynthesis in the light period and then mobilize these sugars at night for growth, respiration, and transport to sink organs. Research on mature oak trees showed that total leaf sugars increased by an average of 16 mg/g dry weight during the day and returned to baseline at night (2). This represents substantial diurnal fluctuation that can produce 30% or more variation in brix readings depending on time of day (3).
Studies on maize have shown that starch and soluble sugars in leaves follow predictable diurnal patterns, with soluble carbohydrates peaking in the afternoon and reaching their minimum before dawn (3). The timing of peak brix values varies by species and growing conditions. Some plants show maximum sugar accumulation at midday, while others peak in the afternoon (2). This means that a brix reading taken at 10 AM might be dramatically different from one taken at 3 PM on the same plant, even though the plant’s nutritional status has not changed.
Weather conditions further complicate matters. Plants have been observed to move sugars to roots in anticipation of storms, sometimes days in advance, causing brix readings to drop substantially even though the plant is not experiencing nutritional stress. Water stress also affects readings, as dehydration concentrates dissolved solids and artificially elevates brix values without indicating better plant health.
Problem 2: Spatial Variation Within Plants
The location where you sample sap makes an enormous difference in the reading you obtain. Research has consistently shown large differences in sugar content between young and old leaves, with old leaves often having substantially different concentrations than new growth (2). In reproductive plants, leaves near fruits typically show the lowest brix readings because fruits have high nutritional demands and act as strong sinks for sugars and other nutrients.
This spatial heterogeneity means that two technicians sampling the same plant but choosing different leaves could easily obtain readings that vary by 50-70%. Without strict standardization of which leaf to sample, when during its development, and from which position on the plant, brix measurements become nearly impossible to compare across samples or over time.
The Logistical Challenge
For brix analysis to be useful as a management tool, it requires an extraordinary level of commitment and consistency. You would need to collect samples at different locations on each plant, within different areas of your growing system, under different weather conditions, and critically, at exactly the same time of day, multiple times per week (4). Because of this inherent variability, effective use requires managing trends rather than individual measurements. Most growers simply do not have the bandwidth to develop the degree of familiarity needed with brix readings for it to become a truly reliable diagnostic tool.
What Brix Cannot Tell You
Perhaps most importantly, even if you could control for all the temporal and spatial variation, brix readings provide very limited actionable information. A low brix reading tells you that soluble solids are low at that moment, but it does not tell you why. Is it a nitrogen deficiency? Phosphorus? Calcium? Is it a problem with root function? Temperature? Light intensity? Water relations? The brix value alone provides no way to differentiate between these possibilities.
Additionally, brix measurements tell you nothing about immobile nutrients like calcium and boron, which do not move readily through the sap. These nutrients are critical for cell wall formation, disease resistance, and fruit quality, yet they remain essentially invisible to brix analysis.
A Better Alternative: Leaf Tissue Analysis
When growers need reliable information about plant nutritional status in hydroponic systems, leaf tissue analysis provides a far more comprehensive and actionable alternative. Unlike brix analysis, which measures only mobile compounds in sap at a single moment, tissue analysis quantifies the total accumulated concentrations of both mobile and immobile nutrients in plant tissues (4).
Tissue analysis provides specific concentration values for nitrogen, phosphorus, potassium, calcium, magnesium, sulfur, and all essential micronutrients. These values can be compared against established sufficiency ranges for your specific crop, allowing you to identify which nutrients are deficient, adequate, or excessive. This specificity enables targeted corrective actions rather than guesswork.
While tissue analysis does require sending samples to a laboratory and waiting for results, it provides a stable measurement that is far less affected by time of day or recent environmental fluctuations. Modern labs can return results within days, and the interpretive frameworks for tissue analysis are well-established across hundreds of crop species.
| Comparison Factor | Brix Analysis | Tissue Analysis |
| Time of day sensitivity | Very high (30-70% variation) | Low |
| Spatial variation within plant | Very high | Moderate |
| Nutrients detected | Soluble solids only (mostly sugars) | All essential elements (15+) |
| Specificity | Non-specific | Element-specific |
| Interpretation | Difficult without extensive experience | Well-established sufficiency ranges |
| Cost per sample | Low | Moderate |
| Actionable information | Limited | Comprehensive |
Practical Recommendations
This is not to say that refractometers have no place in crop monitoring. For specific applications like determining harvest timing for fruits or monitoring sugar accumulation in reproductive organs, brix can be useful. However, for assessing the overall nutritional health of vegetative crops in hydroponic systems, the limitations of sap brix analysis are substantial.
If you are serious about optimizing nutrition in your hydroponic operation, invest in regular tissue analysis rather than relying on brix readings. Sample the most recently matured leaves at consistent growth stages, submit samples to a reputable agricultural laboratory, and use the results to make informed adjustments to your nutrient formulation and delivery. This approach will provide you with reliable, actionable data that can actually improve your crops, rather than numbers that fluctuate wildly based on time of day and sampling location.
The appeal of a quick field test is understandable, but in the case of brix analysis for plant health assessment, the simplicity comes at the cost of reliability and utility. Sometimes the best tools are not the fastest ones, and when it comes to understanding what your plants need, there is no substitute for comprehensive analysis.