The use of phosphites in plant culture
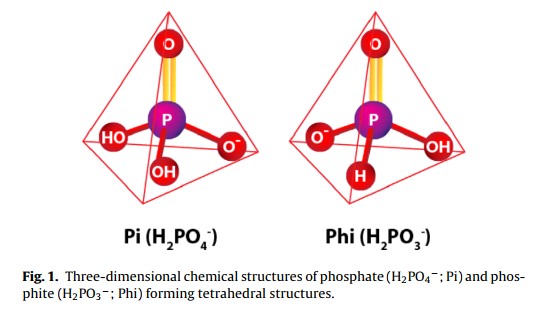
Plants normally get most or all of their phosphorous from inorganic phosphorus sources. Most commonly these sources are monobasic or dibasic phosphate ions (H2PO4– and HPO4-2), which are naturally formed from any other phosphate species at the pH values generally used in hydroponics (5.5-6.5). However these are not the only sources of inorganic phosphorous that exist. Phosphite ions – which come from phosphorous acid H3PO3 – can also be used in plant culture. Today we are going to talk about what phosphite does when used in hydroponics and why it behaves so differently when compared with regular phosphate sources. In research P from phosphate is generally called Pi, so I will follow this same convention through the rest of this post. A good review on this entire subject can be found here.
The role that phosphite (Phi) plays in plant nutrition and development has now been well established. Initially several people claimed that Phi was a better P fertilizer than Pi so researchers wanted to look into this to see if Phi could actually be used as an improvement over Pi fertilization. However research was heavily disappointing, studies on lettuce (here) , spinach (here), komatsuna (here) as well as several other plants showed that Phi fertilization provides absolutely no value in terms of P nutrition, meaning that although plants do absorb and process the Phi it does not end up being used in plant tissue to supplement or cover P deficiency in any way. Furthermore there are some negative effects when Phi is used in larger concentrations (as those required for Pi) so it quickly became clear that Phi is not a good fertilizer at all.
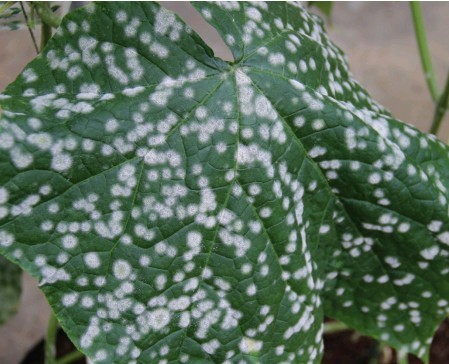
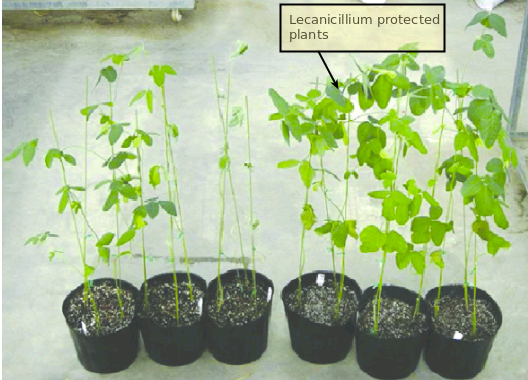
Why should anyone use Phi then? Well, research started to show that some of the earlier positive results of Phi fertilization were not because it was covering Pi deficiencies but mainly because it was offering a protective effect against some pathogens. Research on tomatoes and peppers and other plants (here and here) showed that phosphites had some ability to protect plants against fungi with plants subjected to Phi applications showing less vulnerability to the pathogens. However the evidence about this is also not terribly strong and a few papers have contested these claims.
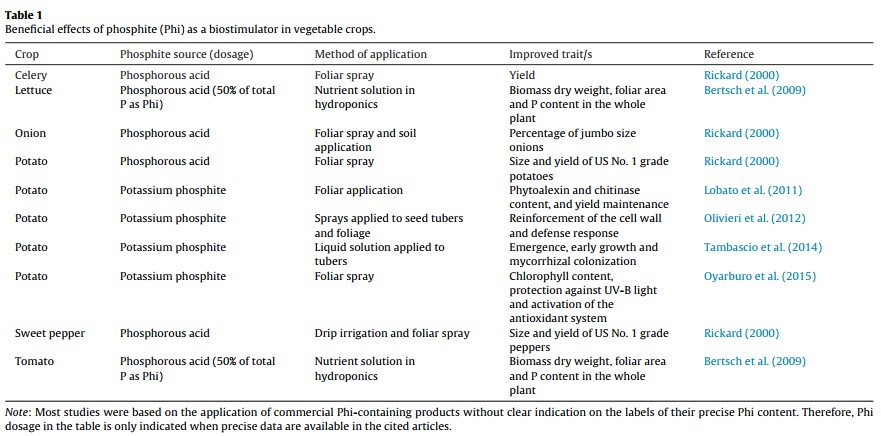
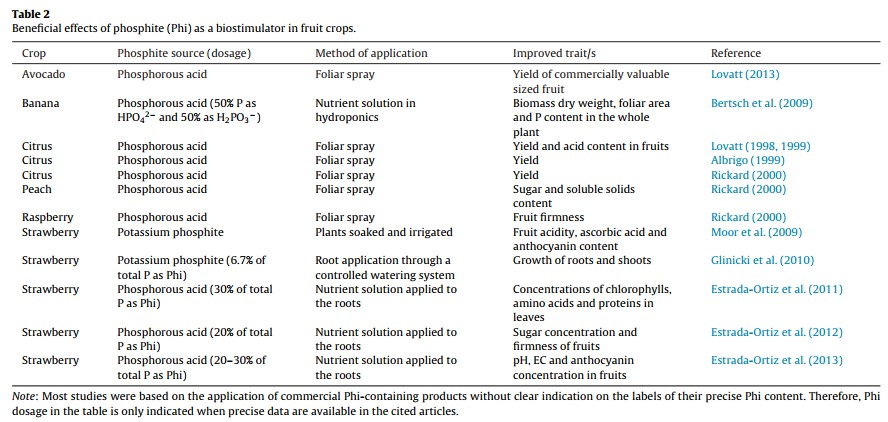
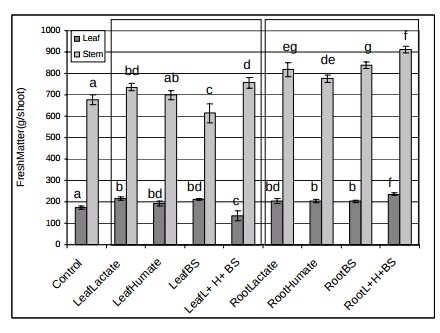
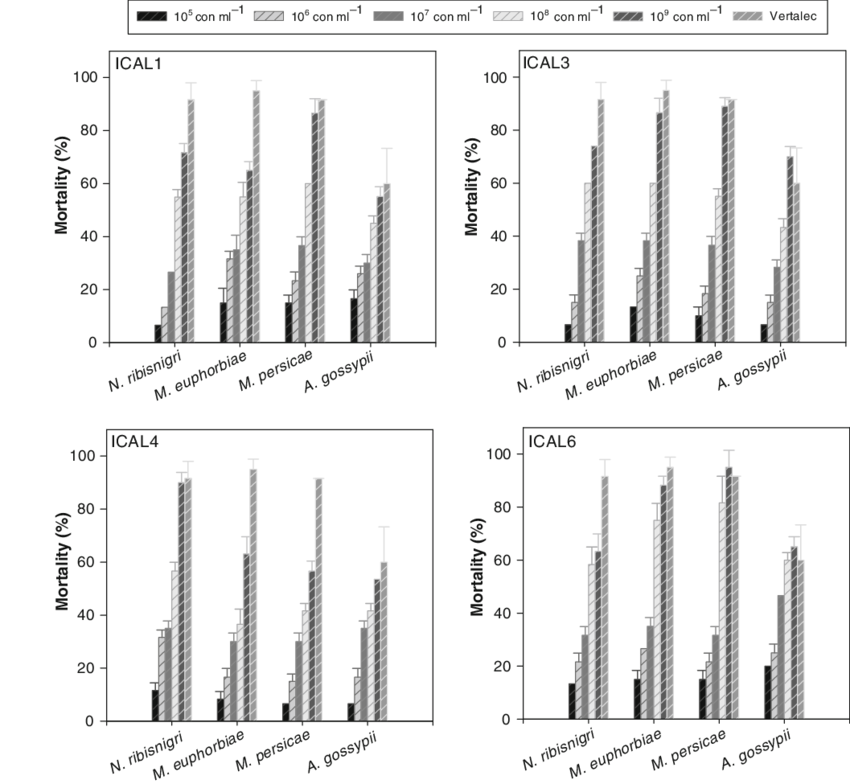
Those who say that Phi is not mainly a fungicide claim that positive results are mainly the effect of Phi acting as a biostimulant (here). These groups have shown through research across several different plant species, including potatoes, onions, lettuce, tomatoes, wheat, oilseed rape, sugar beet and ryegrass that foliar or sometimes root applications of phosphites consistently yield some positive effects, meaning that there is a strong biostimulant effect from the Phi that is not related to either P nutrition or a fungicidal effect. A recent review looking at the overall biostimulant effects of Phi (here) shows how researchers have obtained evidence of biostimulation in potatoes, sweet peppers, tomatoes and several other species (the images in this post were taken from this review). The different studies mentioned in the review show increases in quality and even yields across these different plant species (see tables above).
While we know that Phi is not a good source of P nutrition and we know it can help as a fungicide in some cases it is clear now that under enough Pi nutrition Phi can provide some important biostimulating effects. Negative effects from Phi seem to be eliminated when enough Pi nutrition is present so rather than be thought of as a way to replace or supplement P nutrition it should be thought of as an additive that has a biostimulating effect. Phi may become a powerful new tool in the search for higher yields and higher quality, while not serving as a replacement for traditional Pi fertilization.