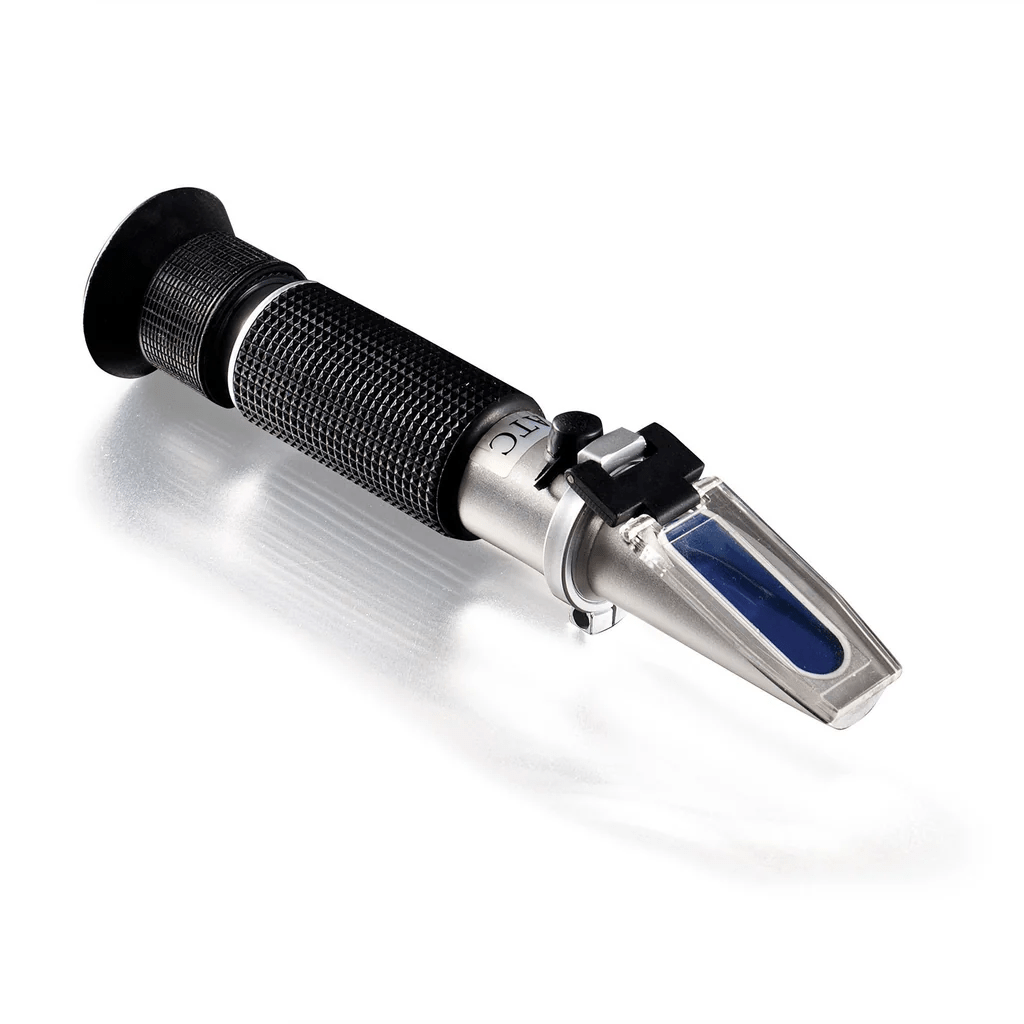
NIR Devices for Leaf Tissue Mineral Analysis
Traditional leaf tissue analysis can cost 50 to 150 USD per sample and take weeks to complete, forcing growers to make nutrient decisions based on outdated information. Near infrared (NIR) spectroscopy devices could theoretically change this reality by providing real time, on site mineral analysis of leaf tissues at a fraction of the cost and time required by conventional laboratory methods.
The Science Behind NIR Technology
Near infrared spectroscopy operates in the electromagnetic spectrum between 700 and 2500 nanometers, measuring the absorption of light by molecular bonds in plant tissues. The technique works by exploiting the fact that organic compounds containing carbon hydrogen (C-H), oxygen hydrogen (O-H), and nitrogen hydrogen (N-H) bonds absorb specific wavelengths of NIR light (1).
The fundamental principle relies on the relationship between chemical composition and spectral signatures. When NIR light penetrates leaf tissue, different molecules absorb energy at characteristic wavelengths, creating a unique spectral fingerprint. Mathematical models, typically using partial least squares regression (PLSR), then correlate these spectral patterns with actual mineral concentrations determined through traditional analytical methods (2).
Importantly, NIR technology detects macronutrients like nitrogen, phosphorus, and sulfur directly because they are major constituents of NIR sensitive organic compounds such as proteins, nucleic acids, and amino acids. In contrast, nutrients that exist primarily in inorganic forms like calcium, magnesium, and potassium are detected indirectly through their associations with organic compounds (3).
Expected Accuracy Levels
Recent studies show that NIR spectroscopy can achieve excellent prediction accuracy for macronutrients, with correlation coefficients (R²) typically ranging from 0.80 to 0.95 for nitrogen, phosphorus, and potassium in various crop species (4). Micronutrients generally show lower accuracy, with R² values between 0.60 to 0.85, due to their lower concentrations and weaker correlations with NIR active organic compounds.
The ratio of performance to deviation (RPD) values provide another measure of model reliability. RPD values above 2.0 indicate good to excellent predictions, while values above 3.0 are considered excellent for analytical purposes (5). Most successful NIR calibrations for major nutrients achieve RPD values between 2.5 and 4.0, making them suitable for practical nutrient management decisions.
However, accuracy varies significantly based on sample preparation and measurement conditions. Dried and ground leaf samples consistently produce better calibrations compared to fresh leaves, with improvements in R² values of 0.10 to 0.20 for most nutrients. This standardization eliminates moisture content variability and particle size effects that can interfere with spectral measurements (6).
Calibration Challenges and Requirements
Developing robust NIR calibrations requires extensive datasets spanning the full range of nutrient concentrations likely to be encountered in practice. Most successful models require 100 to 300 calibration samples representing different varieties, growth conditions, and nutritional states. The quality of reference analytical data used for calibration directly impacts the final model accuracy, making precise laboratory analysis of training samples essential.
Spectral preprocessing represents another critical calibration challenge. Raw NIR spectra contain noise from light scattering, baseline shifts, and instrument variability that must be corrected before model development. Common preprocessing methods include multiplicative scatter correction (MSC), standard normal variate (SNV), and various derivative transformations, with the optimal approach varying by crop species and nutrient (7).
Model transferability between different instruments, locations, and time periods poses ongoing challenges. Calibrations developed for one NIR device often require recalibration when applied to different instruments, even from the same manufacturer. This limitation necessitates either standardization procedures or the development of universal calibration models that work across multiple platforms.
Real World Application Issues
Field deployment of NIR devices introduces additional complications not encountered in laboratory settings. Temperature variations can significantly affect spectral measurements, as changing temperatures alter the abundance of organic compounds in plant tissues and the optical properties of the instrument itself (8).
Moisture content represents perhaps the most significant challenge for in field NIR analysis. Water absorption bands can overwhelm nutrient signals in fresh leaf tissue, reducing prediction accuracy by 20 to 40% compared to dried samples. Some portable NIR devices attempt to compensate through moisture correction algorithms, but these approaches add complexity and potential error sources.
Plant species specificity also limits practical implementation. Most NIR calibrations work best for the specific crop and varieties used in model development. Attempting to apply potato leaf calibrations to tomato plants, for example, typically results in poor accuracy. This specificity requirement means that commercial operations need either species specific calibrations or must accept reduced accuracy when using general purpose models.
Comparison with Traditional Analytical Techniques
| Parameter | NIR Spectroscopy | ICP-OES | Atomic Absorption | Ion Chromatography |
|---|---|---|---|---|
| Analysis Time | 30 seconds | 5-10 minutes per sample | 2-5 minutes per element | 15-30 minutes |
| Sample Preparation | Minimal (grinding optional) | Acid digestion required | Acid digestion required | Water extraction |
| Cost per Analysis | $1-5 | $25-50 | $15-30 | $20-40 |
| Multi-element Capability | Yes (simultaneous) | Yes (simultaneous) | No (single element) | Limited |
| Accuracy (under ideal calibration and sampling conditions) | Moderate (R² 0.80-0.95 majors) Poor (R² < 0.6-0.85 micros) |
Excellent (R²>0.99) | Excellent (R²>0.99) | Very Good (R²>0.95) |
| Detection Limits | Moderate (0.1-1.0%) | Excellent (ppm level) | Very Good (ppm level) | Good (10-100 ppm) |
| Equipment Cost | $15,000-50,000 | $150,000-300,000 | $25,000-75,000 | $50,000-100,000 |
| Portability | High (handheld available) | None (lab only) | Low (benchtop) | Low (benchtop) |
| Chemical Safety | None (no chemicals) | High risk (acids) | High risk (acids) | Low risk |
| Operator Training | Minimal | Extensive | Moderate | Moderate |
Economic Considerations for Commercial Growers
The economics of NIR technology become compelling for operations analyzing more than 200 leaf samples annually. Traditional laboratory analysis costs typically range from 50 to 150 USD per sample including shipping and handling, while NIR analysis costs drop to 1 to 5 USD per sample after initial equipment investment. For a medium scale greenhouse operation testing weekly throughout the growing season, this represents potential savings of 10,000 to 30,000 USD annually.
However, the initial capital investment for quality NIR equipment ranges from 15,000 to 50,000 USD, depending on spectral range and measurement capabilities. Handheld devices suitable for basic macronutrient analysis start around 15,000 USD, while benchtop instruments capable of full spectrum analysis and micronutrient detection can exceed 50,000 USD (9).
Current Limitations and Future Prospects
Despite significant advances, NIR technology for leaf analysis still faces several limitations. Micronutrient detection remains challenging due to low concentrations and weak spectral signatures. Reliable calibrations for elements like iron, zinc, and manganese typically require concentrations above 100 mg/kg, limiting utility for detecting subtle deficiencies (10).
The development of machine learning approaches and artificial neural networks shows promise for improving prediction accuracy and handling complex spectral relationships. These advanced mathematical techniques can potentially extract more information from NIR spectra than traditional regression methods, particularly for challenging nutrients and mixed species applications. However the success of these techniques hinges on the amount of available data, if the learning library is not big enough, or your crop deviates substantially from it, your accuracy could be even worse than without these complex approaches.
Practical Recommendations
For commercial growers considering NIR technology, the decision should be based on sample volume, required accuracy, and available budget. Operations analyzing fewer than 100 samples annually are generally better served by traditional laboratory analysis. However, high throughput operations, research facilities, and precision agriculture applications can achieve significant benefits from a well calibrated NIR implementation.
When implementing NIR technology, invest in proper calibration development using samples from your specific crops and growing conditions. Generic calibrations provided by instrument manufacturers rarely achieve the accuracy needed for reliable nutrient management decisions. Plan for ongoing calibration maintenance and periodic validation against traditional analytical methods to ensure continued accuracy. NIR instruments that cannot be properly calibrated for the exact conditions of the grower are much more likely to lead to unusable results.
The future of leaf tissue analysis clearly points toward rapid, non destructive technologies like NIR spectroscopy. While current limitations prevent complete replacement of traditional methods, NIR devices offer valuable screening capabilities and real time insights that can significantly improve nutrient management efficiency under ideal conditions. As the technology continues to mature and costs decrease, adoption will likely accelerate across all scales of agricultural production.