Differences between labels and actual composition values in commercial hydroponic fertilizers
Whenever I am hired to duplicate a company’s fertilizer regime based on commercial products, I always emphasize that I cannot use the labels of the products as a reference because of how misleading these labels can be. A fertilizer company only needs to tell you the minimum amount of each element it guarantees there is in the product, but it does not have to tell you the exact amount. For example, a company might tell you their fertilizer is 2% N, while it is in reality 3%. If you tried to reproduce the formulation by what’s on the label you would end up with substantially less N, which would make your mix perform very differently. This is why lab analysis of the actual bottles is necessary to determine what needs to be done to reproduce the formulations.
How bad is this problem though? Are companies just under-reporting by 1-5% in order to ensure they are always compliant with the minimum guaranteed amount accounting for manufacturing errors or are they underreporting substantially in order to ensure all reverse engineering attempts based on the labels fail miserably? I have a lot of information about this from my experience with customers – which is why I know the problem is pretty bad – but I am not able to publicly share any of it, as these lab tests are under non-disclosure agreements with them. However, I recently found a website from the Oregon government (see here), where they share all the chemical analysis of fertilizers they have done in the past as well as whatever is claimed on labels.
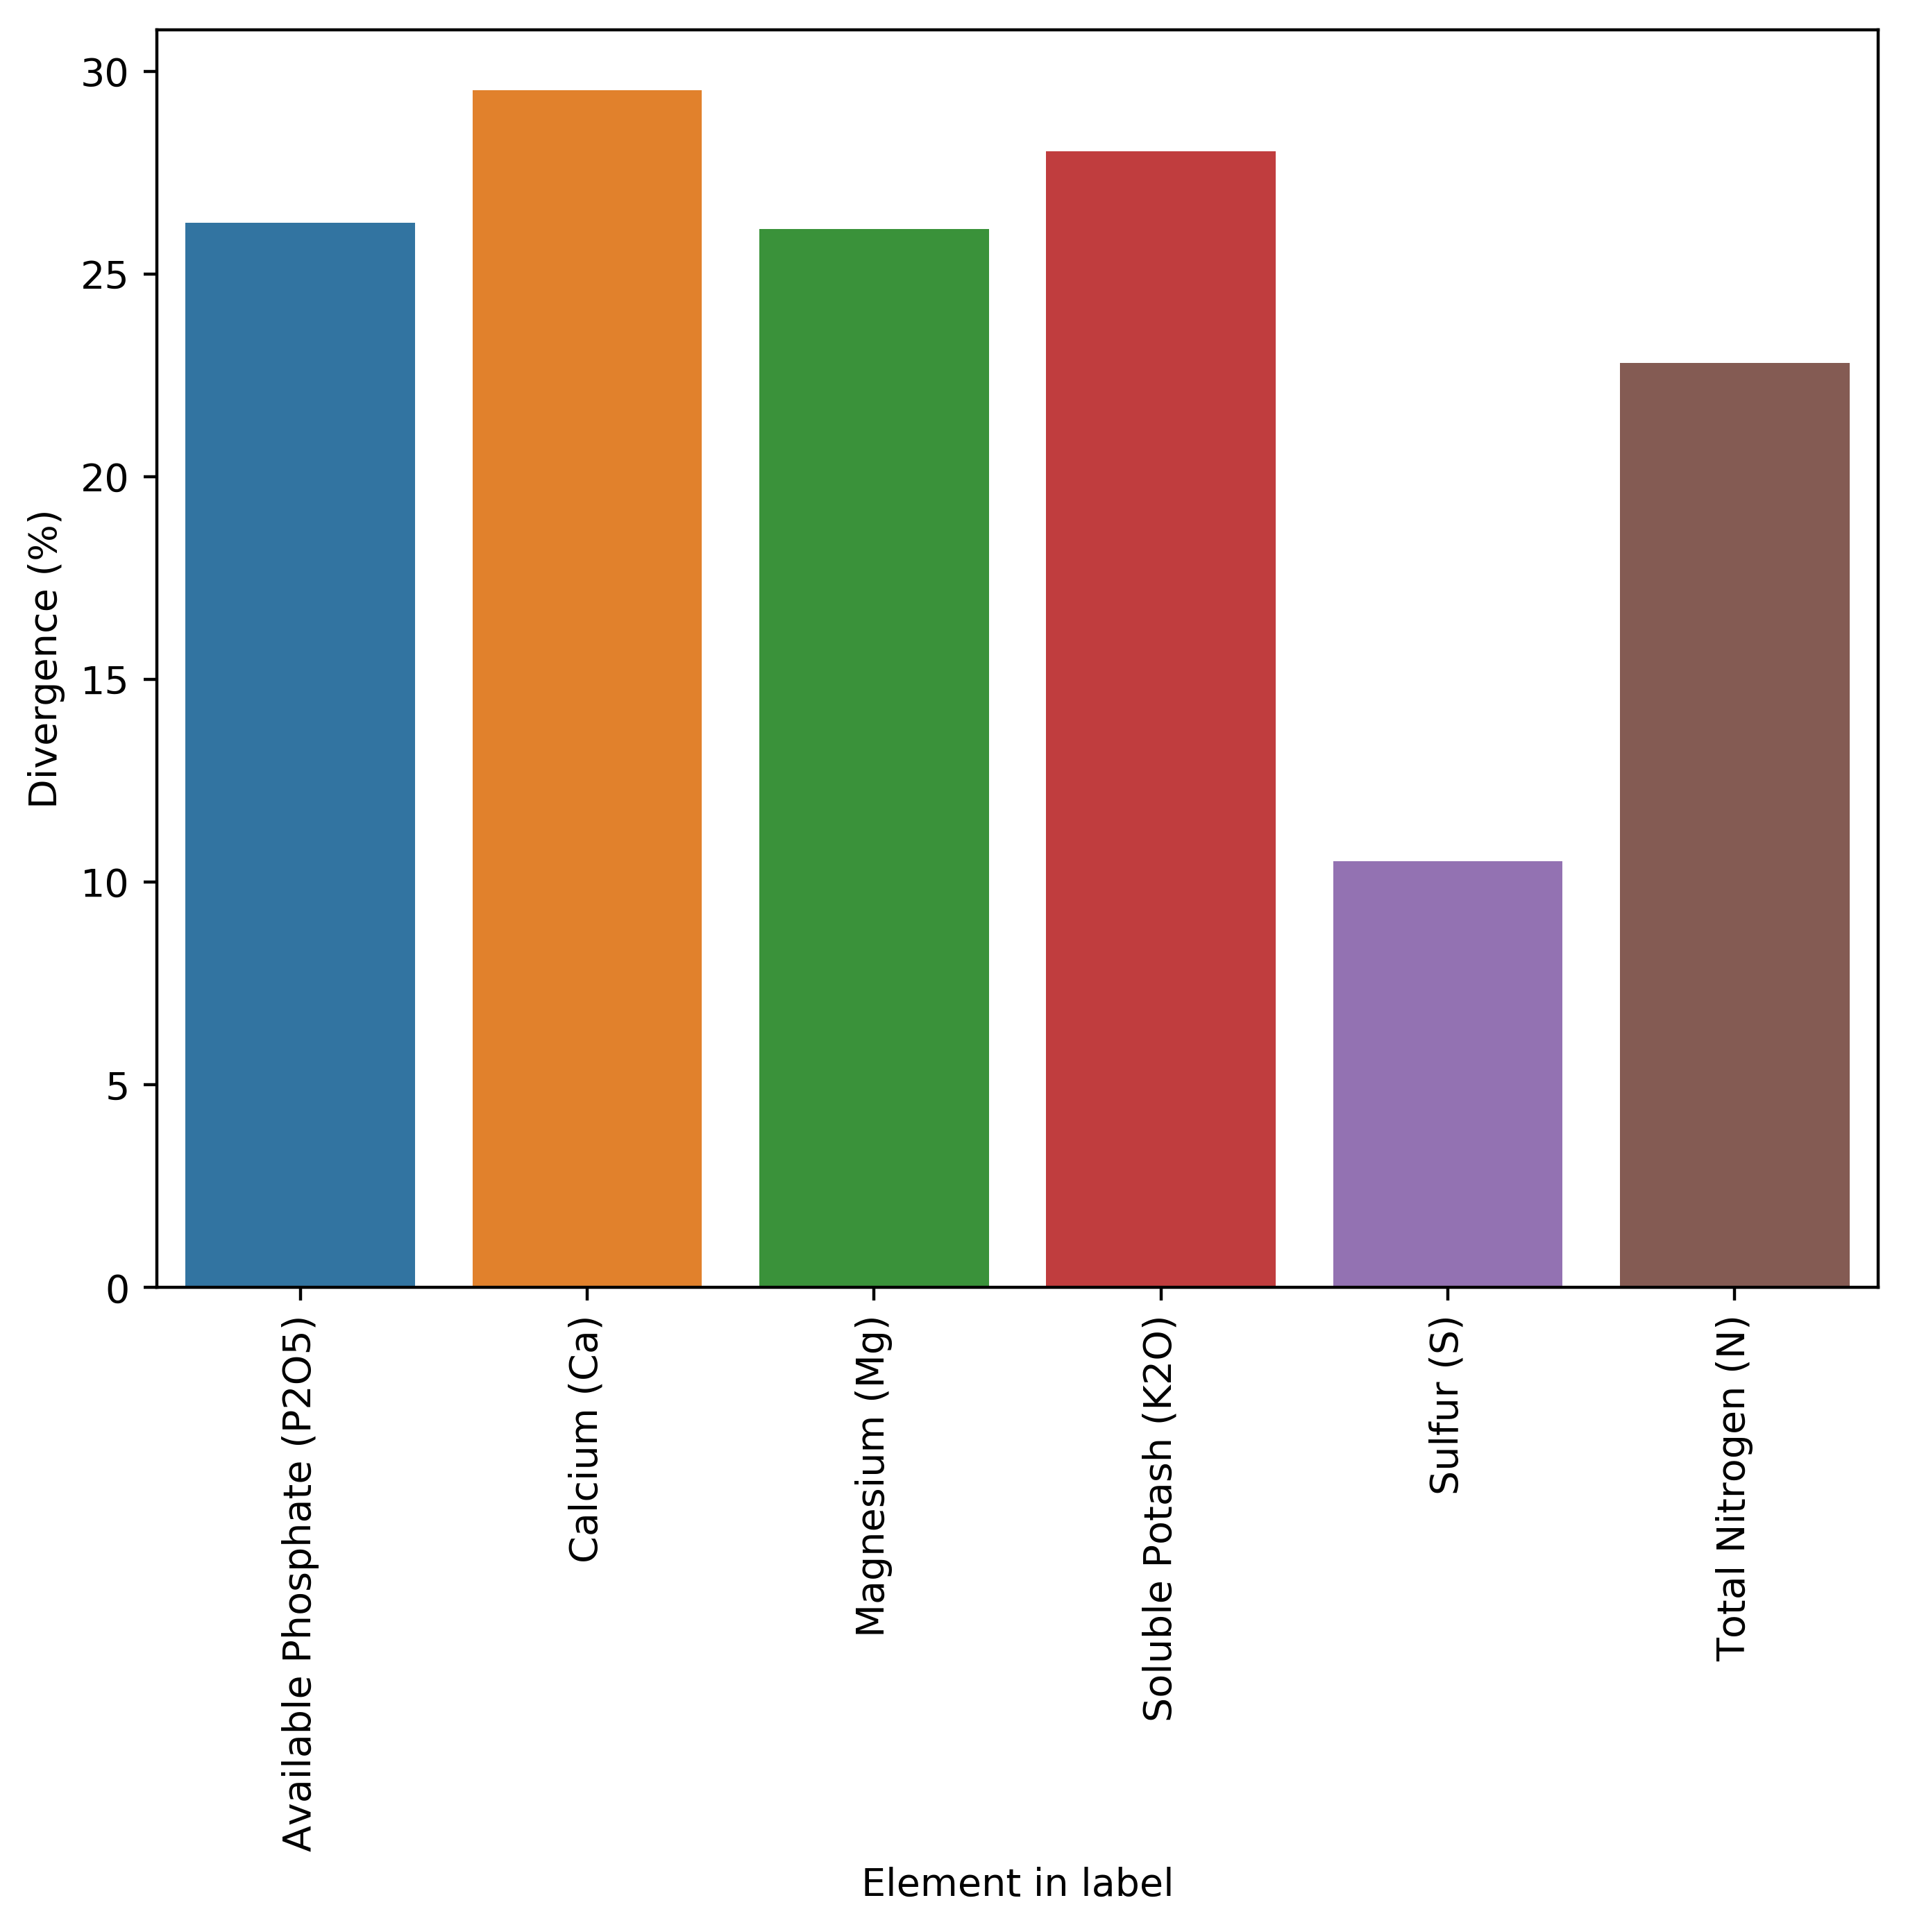
The Oregon database is available in pdf form, reason why I had to develop a couple of custom programming tools to process all the information and put it into a readable database. So far I have only processed the fertilizers that were registered in 2015, but I am going to process all the fertilizers available in their database up until 2018 (the last year when this report was uploaded). However, you can already see patterns emerging for just the 2015 data. That year there were 245 fertilizers tested, from which 213 contained N, P, K, Ca, S or Mg. If we compare the lab results for these elements with the results from the lab analysis, we can calculate the average deviation for them, which you can see above. As you can see, companies will include, on average, 20%+ of what the labels say they contain. This is way more of a deviation than what you would expect to cover manufacturing variations (which are expected to be <10% in a well-designed process) so this is definitely an effort to prevent reverse engineering.

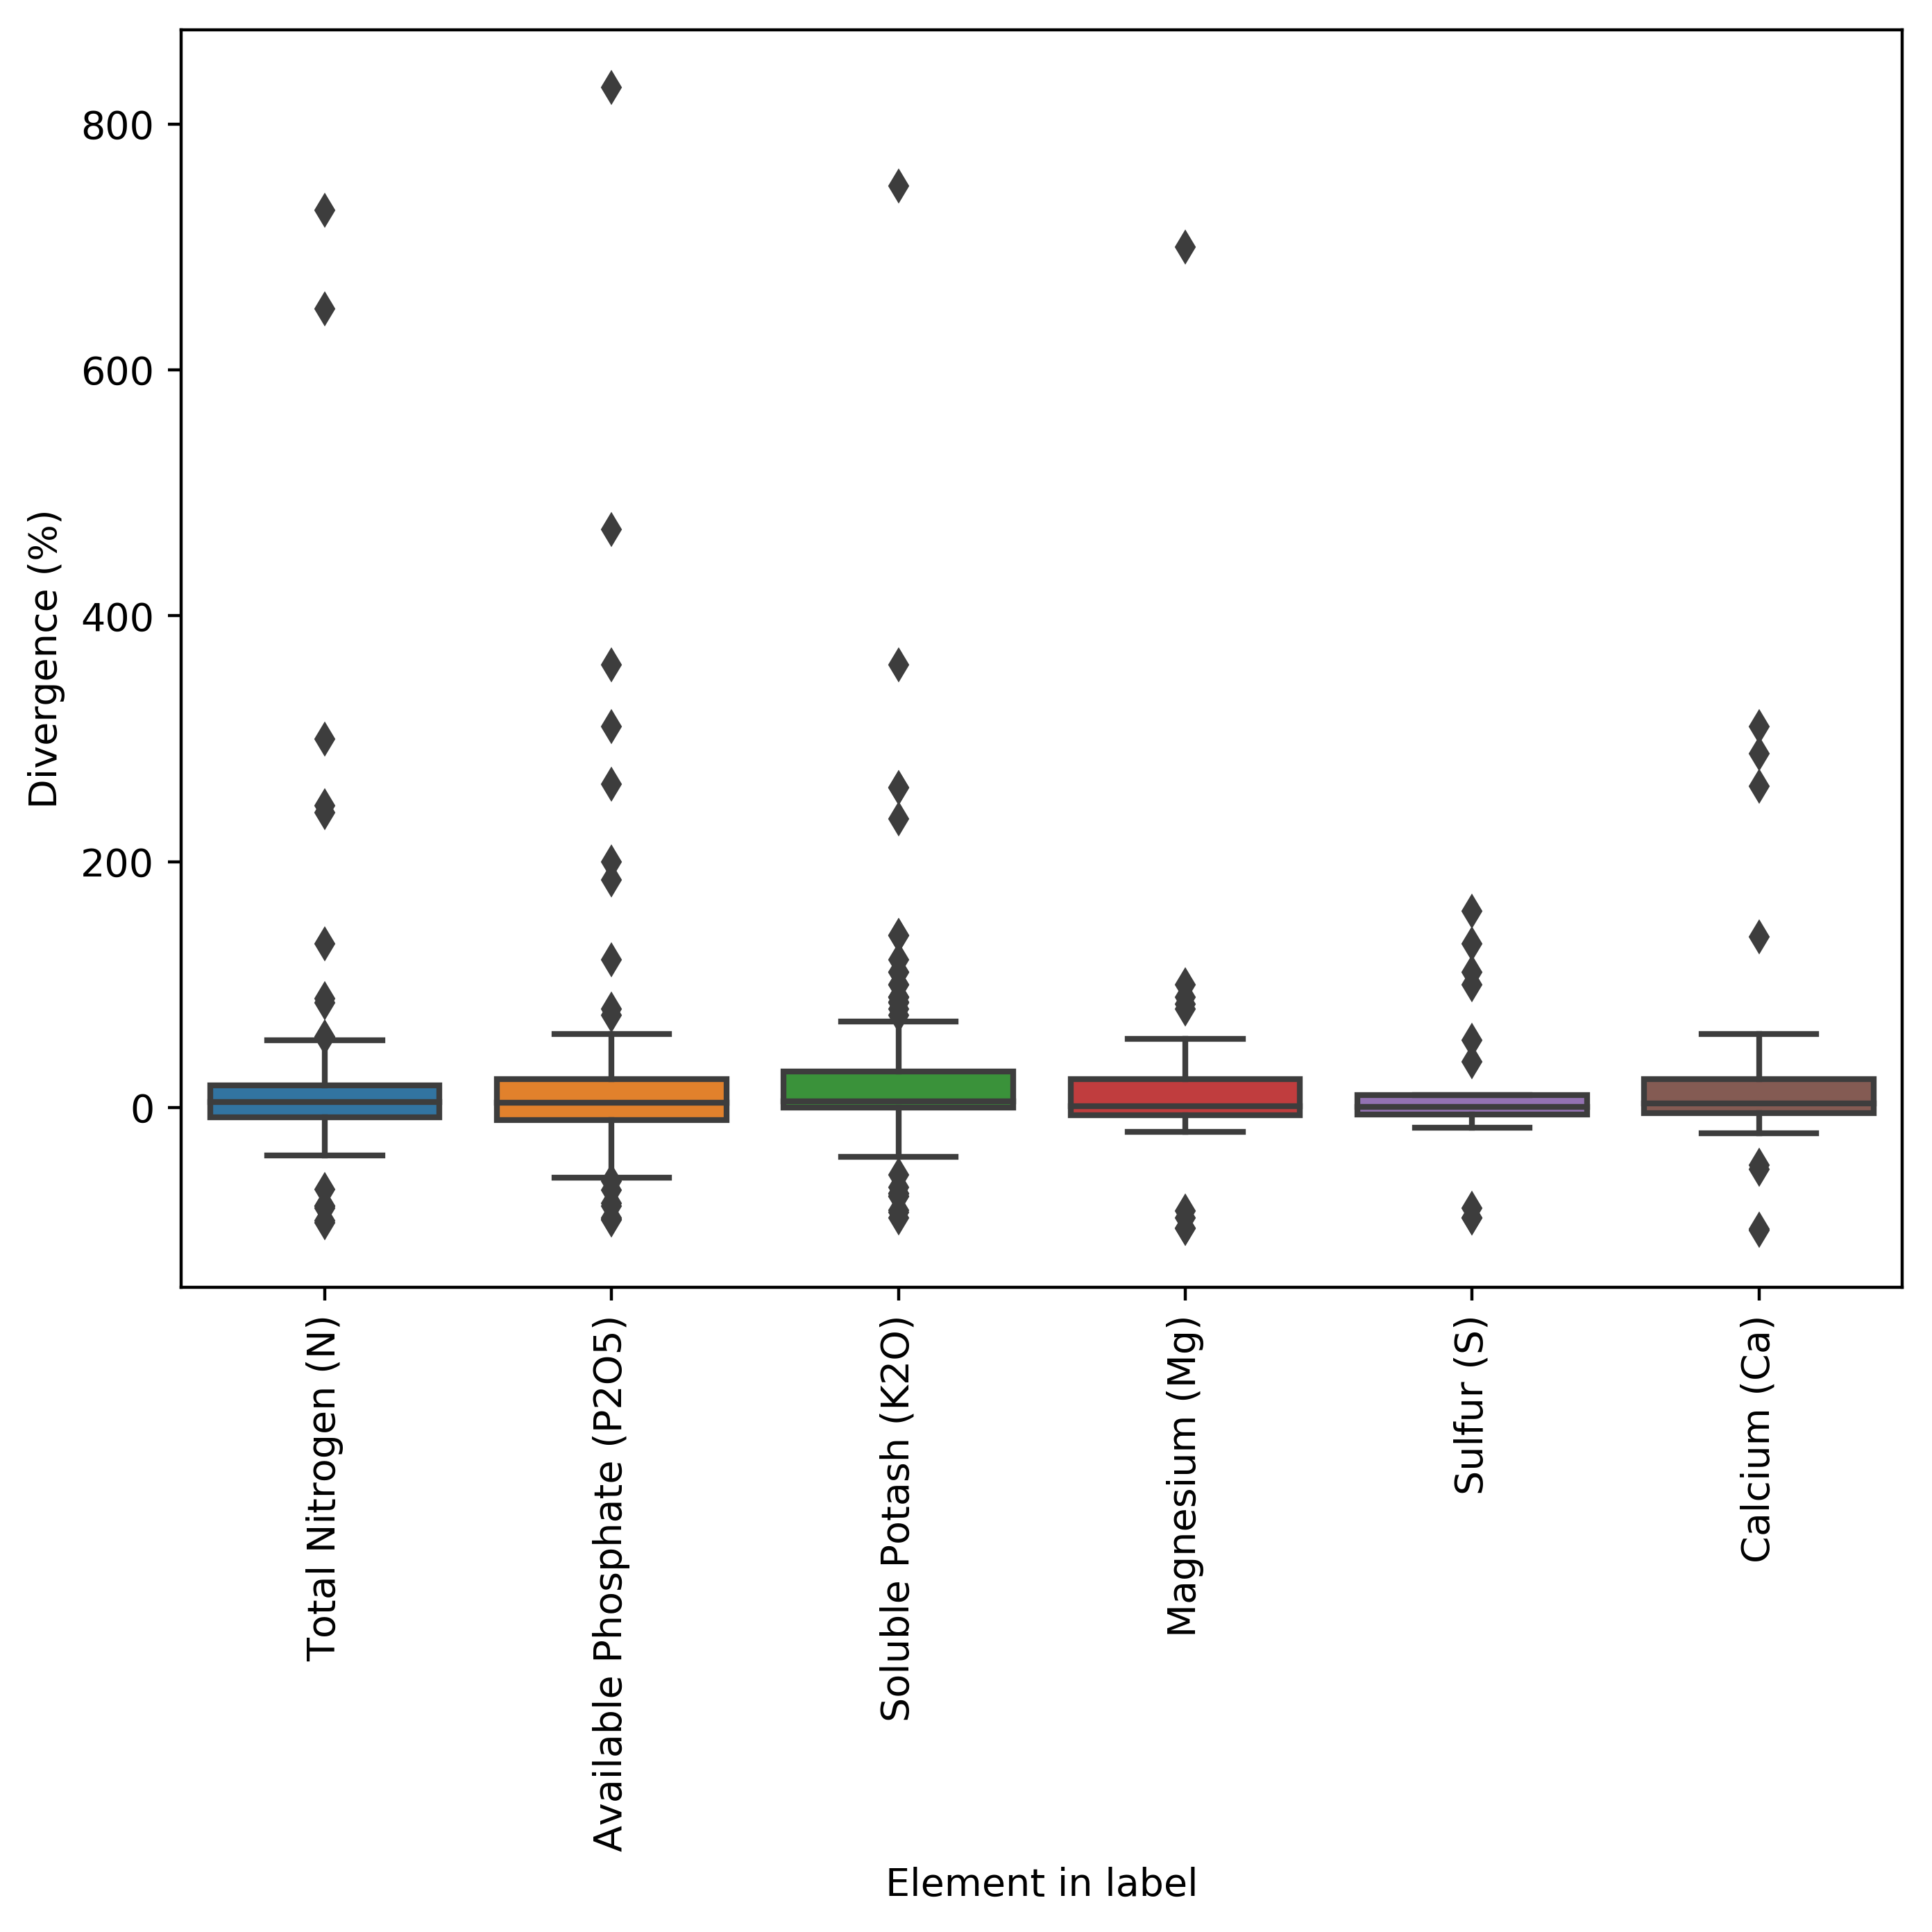
Furthermore, the deviations are by no means homogeneous in the database. The above graphs showing the box plot and median deviation values, show us that most people will actually be deviated by less than 5% from their label requirements, but others will be very largely deviated, with errors that can be in the 100%+ deviation from their reported concentration. In many cases, companies also have negative deviations, which implies that the variance of their manufacturing process was either unaccounted for or there was a big issue in the manufacturing process (for example they forgot to add the chemical containing the element). These people would be in violation of the guaranteed analysis rules and would be fined and their product registrations could be removed.
With this information, we can say that most people try to report things within what would be considered reasonable if the label is to remain accurate (deviations in the 1-5% range) to account for their manufacturing issues but many companies will choose to drift heavily for this and report values that are completely misleading relative to the labels. These companies are often the ones that are most widely used as they are the ones who want to protect themselves from reverse engineering most aggressively.
Take for example General Hydroponics (GH). Their FloraGro product is registered with an available phosphate of 1%, while the actual value in the product is 1.3%, this is a 30% deviation, far above the median of the industry. They will also not just underreport everything by the same amount – because then your formulation would perfectly match when you matched their target EC – but they will heavily underreport some elements and be accurate for others. In this same Floragro product, the K2O is labeled as 6% and the lab analysis is 5.9%, meaning that they reported the value of K pretty accurately. However, by underreporting some but not others, they guarantee that you will skew your elemental ratios by a big margin if you try to reverse engineer the label, which will make your nutrients work very differently compared to their bottles.
As you can see, you just cannot trust fertilizer labels. Although most of the smaller companies will seek to provide accurate labels within what is possible due to manufacturing differences, big companies will often engineer their reporting to make it as hard as possible for reverse engineering of the labels to be an effective tactic to copy them. If you want to ever copy a commercial nutrient formulation, make sure you perform a lab analysis so that you know what you will be copying and never, ever, rely solely on the labels. I will continue working on this dataset, adding the remaining fertilizers, and I will expand my analyses to include micronutrients, which are covered by Oregon government tests.