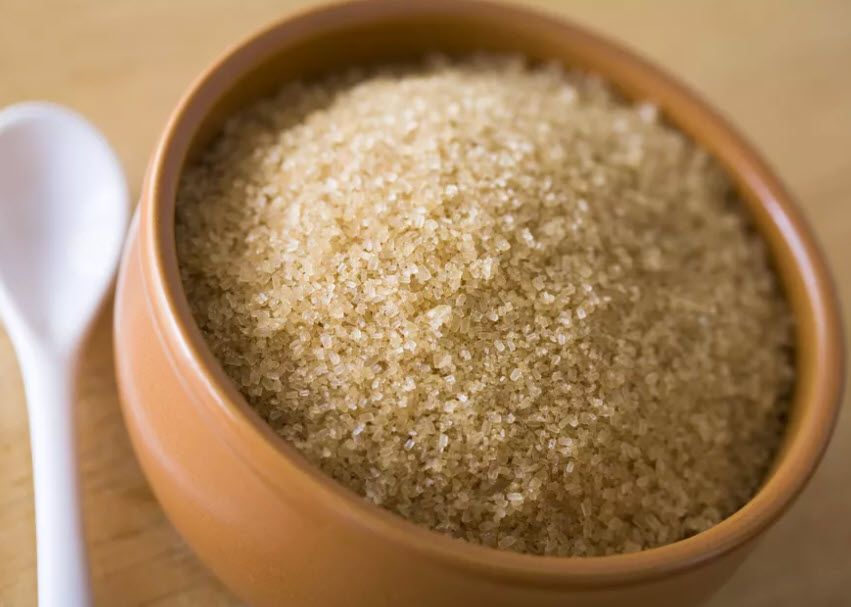
Potassium concentration and yields in flowering plants

From the different nutrients that are needed by plants we have known for more than 4 decades that potassium is of critical importance to flowering/fruiting plants. Potassium is one of the most highly limited nutrients in soil due to its high mobility and great increases in yields have been achieved with both potassium fertilization in soil and the use of properly balanced nutrient solutions containing enough potassium in hydroponics. But how important is potassium and what is its ideal concentration in hydroponic nutrient solutions when growing flowering plants? Today we are going to take a look at the scientific literature about potassium and what the optimum levels of potassium for different flowering plants might be in order to maximize yields.

There are many studies in the scientific literature dealing with the effect of potassium on various flowering plants. Earlier evidence from the 1980s pointed to optimum concentrations of potassium being close to the 160-200 ppm range. The book “mineral nutrition” by P.Adams (here) summarizes a lot of the knowledge that was available at the time and shows that for the growing techniques available at the time using greater concentrations of K was probably not going to give a lot of additional benefit.

However newer evidence from experiments carried out within the past 10 years shows that optimum potassium concentration might depend on a significant variety of factors, from which media, other nutrient concentrations and growing system type might play critical roles. For example study on strawberries in 2012 (here) showed optimum concentrations of K to be around 300 ppm for strawberries and the optimum media to be a mixture of peat+sand+perlite (image from this article included above).

Evidence from experiments on tomatoes (link here and image from this article above) also shows that for tomatoes the actual optimum concentration of K might actually be larger under some condition with the optimum in this study in terms of fruit quality and yields being 300 ppm. In this last case the tomatoes were grown using a nutrient film technique (NFT) setup. However there have also been studies under other growing conditions – like this one on reused pumice – which shows that increasing K concentrations to 300ppm can actually have detrimental consequences. In this case tomatoes fed at 200, 290 and 340ppm of K had very similar results when using new substrate but the old substrate heavily underperformed when high K concentrations were used.

Papers published on the effect of different K concentrations in melons (here) and cucumbers (here) also point to optimal concentrations in the 200-300 ppm range and for the optimum N:K ratio to be between 1:2 and 1:3 for these plants. This is probably the reason why you will often find suggested nutritional guidelines for flowering plants – like those below taken from here – mostly suggesting K concentrations in the 250-350ppm range. However you will often find that they directly contradict research papers, like this guideline suggesting K of 150 ppm for strawberries while we saw in a recent paper that 300ppm might be better. This is most probably due to differences in the sources used which might have used different growing systems or plant varieties which responded to other conditions better.

All in all the subject of K concentration in hydroponics is no simple one. Using low K will limit your yields tremendously but increasing your K very high can also harm your plants, especially depending on the type of media you are using. In general aiming for a K concentration between 200-250 ppm is safest but in many cases increases to the 300-400ppm range can bring significant increases in plant yields. A careful study of the available literature and the actual growing conditions that the plants will be subjected to will be key in determining what the best K concentration to use will be. Alternatively carrying out adequately designed experiments under your precise growing environment will help you carry out an evidence-based decision about what K concentration to use.


Five important things to consider when doing foliar spraying

Foliar spraying is a true and tested way to increase yields and prevent issues in plant culture. Both soil and hydroponic growers have used foliar fertilizer applications to increase yields and prevent problems due to nutrient deficiencies during the past 50 years. However there is a lot of mystery and confusion surrounding foliar fertilizer applications, reason why this technique is often applied incorrectly or sub-optimally. Today I want to talk about 5 key pieces of information to consider when doing foliar fertilization so that you can be more successful when applying it to improve your crop results and reduce deficiency problems. If you want to learn more about these factors I suggest you read the following reviews on foliar feeding (here, here and here). Second table in this post was taken from this study on wheat.

Image result for foliar spray

Foliar fertilization is not root fertilization. A usual problem when doing foliar fertilization is to think that the same products can be used for leaves and roots. When you want to increase your crop yields using foliar fertilization you should definitely not use the same products and concentrations you use for soil. There are for example some chemical substances that you would never want to apply to the roots that have actually shown to give better outcomes in leaves. A good example is calcium chloride which is a huge mistake in root fertilizers but a great choice when doing foliar fertilization.

Foliar fertilizers should generally be much more concentrated. When people apply foliar fertilization they usually apply much lower concentrations because they are afraid of burning leaves. Although this can certainly happen if the foliar fertilizer is badly designed research has shown that the best results are obtained with much higher concentrations than what you generally use for the roots. For example when you apply an iron foliar fertilization regime you generally use a concentration of 500-1200 ppm of Fe while in root applications you only very rarely go beyond 4-5 (most commonly 1-3 ppm). Usually concentrations in foliar fertilizers will be much higher and if the fertilizer is correctly designed this will give much better results. The graph below (taken from the first review linked above), shows some of the most commonly used fertilizer concentrations.

Surfactants are very important (don’t use dish washing soap!). Leaf coverage is very important in foliar applications because you want the fertilizer to be evenly spread across the entire leaf not “clumped” into drops due to surface tension. Many people have trouble with nutrient burn due to bad fertilizer design that causes inadequate leaf coverage. However all surfactants are not created equal and ionic fertilizers are very undesirable for this task due to their interaction with leaf tissue and fertilizers. Due to this reason you should NOT use something like dish washer liquid soap but a proper non-ionic surfactant like a polysorbate. The surfactant will be a very important part of your foliar fertilizer formulation.

Timing is also critical. The time when you do your foliar sprays applications is also very important for optimal results. In general you want the leaf stomata to be open and the vapor pressure deficit to be lower so the best time to do foliar spraying is usually during the afternoon after temperatures have dropped significantly. For most time zones this usually means sometime after 3PM. Doing foliar applications sooner can lead to much larger stress due to a higher vapor pressure deficit – risking burns as well – while doing it later leads to less efficient absorption due to the stomata being closed. If applying the spray at this time is not possible then early morning often works as well. Make sure you measure your daily temperature/humidity fluctuations to ensure you don’t do foliar sprays at a high VPD.

Image result for foliar spray yield

Couple adequate additives for yield increases. Research has shown that while nutrient foliar spraying can enhance yields significantly under sub-optimal root feeding conditions if the root concentrations are already optimal – as in a well managed hydroponic crop – it is hard for simple nutrient foliar spraying to provide a lot of benefit. However there are several biostimulants that are poorly absorbed through the root zone that can give you much better results when used as foliar sprays. Additives like salicylic acid and triacontanol can make sure that your nutrient foliar spray gives you maximum additional benefits.

As you can see there is a lot to the design of an adequate foliar spray. You must consider that the substances you use need to be fit to the purpose – not necessarily the same as for root applications! – and that your concentrations, surfactants, additives and application times are adequate. Now that you are aware of these factors you should take them into account when designing your next round of foliar spraying for your crops.


Using titanium to increase crop yields

There are many additives that can be used to enhance the yield of flowering crops. Some have been covered in this blog – like silicon – while others haven’t been mentioned here. Today we are going to talk about a rarely discussed additive that is infrequently used in plant culture these days: Titanium. I want to talk about this additive in light of a literature review that came up recently (April 2017) about the use of Titanium in crop production. The magazine where this review came from (Frontiers in Plant Science) is a magazine that often has good content in the field of innovative crop enhancing techniques.

Titanium use in plant culture is not new. From the early 1980s people started to experiment with titanium as techniques were developed in order to produce titanium chelates that could be used in foliar applications. Basically all reports of yield increases – that show wonderful increases up to even 95.3% in yields – come from a paper on the biological importance of titanium by Dr. István Pais in 1983 and then another publication in 1991 by the same person (here). Other authors have also showed increased yields (here and here) although in some cases in conjunction with other additives (like Si) with results often much less dramatic than the initial 1983 papers. Titanium nanoparticles have also been tested and their effect has mostly been negative with decreases in plant growth and often DNA damage. For this reason when using titanium you want to go with a soluble chelate and not nanoparticle sources.

Creating aqueous stable Ti is not a cake walk. There is currently only one product that carries water soluble Ti (called Tytanit) and as far as I can tell no other commercial products for the application of Ti exist at this moment. This tytanit product is most probably titanium ascorbate – the most popular chelate used – but other organic chelates, like Ti citrate, might be usable as well. Preparing Ti ascorbate is not so easy to get as well – you cannot just buy it on ebay/alibaba as it’s not stable as a solid – so you need to prepare it from scratch. Titanium chemistry in solution is sadly very complicated.

However there is probably a route to the easy preparation of such complexes using a simple method involving titanium dioxide and ascorbic acid. We know from dissolution studies of titanium dioxide that it can be dissolved significantly by ascorbic acid but the final concentration of these solutions is not very high with a final concentration of around 0.025M of Ti possible in solution using this method, with a surrounding concentration of 0.15M of ascorbic acid. More acid does not help dissolve more titanium dioxide as this seems to be the solubility limit of the titanium complex. This gives you around 1.2g/L of Ti which you need to dissolve 500-1000x to arrive at the recommended application rate of 1-2 ppm. This will give a final ascorbic acid concentration of 26ppm which is acceptable as an additive as well.

Obviously there are some further formulation steps necessary to get the above to work correctly but this outlines the basics to develop a concentrated titanium ascorbate product that can be used for the creation of a Titanium supplement. Industrally this can be achieved much more efficiently with the use of titanyl sulfate which is a readily soluble and easy to get industrially – but hard to get for your home – form of titanium. You can see this patent for examples of how a fertilizer using titanyl sulfate can be prepared.

Evidence about titanium – applied as titanium ascorbate in a foliar spray – being positive for crops is significant. Various positive effects have been shown across a significant variety of plants across several different plant types – tomatoes, beans, peppers – by different authors. The effect on yields is not so clear – probably in reality not as large as shown in the original studies, but probably significant enough to warrant further studying. The development of low-cost processes for the manufacturing of titanium fertilizers will further enhance their use and increase our knowledge about their true capabilities. More studies with ascorbic/ascorbate controls will also show us clear evidence of whether we are seeing effects related with the ascorbate or the actual Ti chelate.


Phosphorous toxicity and concentration in higher plants

If you search the web for symptoms of nutrient toxicities you will often find clear pictures and descriptions for most elements. Feed a plant too much nitrogen and it will grow leggy and weak, with dark leaves and long stems, feed it too much boron and you will see yellowing and tissue necrosis. However you will struggle to find descriptions for toxicity symptoms for potassium (K) or phosphorous (P). Is there really no P or K toxicity? Why are they no pictures or clear ideas of how these problems look? Today I am going to talk a bit about P toxicity and why it’s so difficult to reach levels where plants react very negatively to ions from the phosphate family. Images posted were taken from articles cited within this post.

You will often find websites that talk about P toxicity as saying that it is rare or that what it causes is mainly problems with other elements. In general increases in P concentration can cause problems with other elements particularly because the solubility of dihydrogen phosphate salts (H2PO4), salts that form with the ionic form of phosphate that’s mainly present around the pH values used in hydroponics (5.5-6.5) can be very insoluble. You will struggle to find solubility values for heavy metal dihydrogen phosphates, but Fe, Zn and Cu dihydrogen phosphates can be reasonably presumed to be poorly soluble. However calcium dihydrogen phosphate has a solubility of 20g/L at 25°C and is therefore very soluble, so no problems with Ca due to having a lot of phosphorous (this salt is also known as mono calcium phosphate).

The solubility of Ca dihydrogen phosphate is in fact very important because rock phosphate – tricalcium phosphate – is one of the main sources of phosphorous in soil and it dissolves to form protonated phosphate species at the pH usually created around plant roots. This means that many plants evolved with very large occasional concentrations of dihydrogen phosphate around them and therefore they generated mechanisms to down-regulate the uptake of phosphorous from really high concentrations.

There is strong evidence about the above. In fact plants that evolved in phosphorous-poor soils did not evolve mechanisms for down-regulation and do exhibit P toxicity even at moderate concentrations of this element. A few plants native to Australia exhibit this behavior, you can read more about this here. Due to this fact many plants can be cultured in media that is amended with fertilizers that generate large local concentrations of phosphorous when watered without showing any strongly negative effects. Note however that plants will eliminate these down-regulation mechanisms significantly if they are in a P deficient media and if you feed them P rapidly you can cause P toxicity just because the plant couldn’t react fast enough to the large increase in P concentration. See for example this study using P deficient Barley which accumulated toxic levels of P upon supplementation although this did not happen when the plants were constantly exposed to high P levels.

In hydroponics we do see excess of P manifest itself as deficiencies of other elements because of the solubility issues for heavy metal acid phosphates mentioned above. Several studies show the strong link between P concentration and the availability of some micro-elements. For example this paper shows the relationship between P and Zn and how the relationship corresponds with Zn phosphate precipitation in the roots. However if heavy metals are properly chelated we in fact don’t see these problems. I have made experiments with plants – basil and mint – cultivated in 600 ppm of P where I have failed to see any significant problems although I have failed to find any papers that describe experiments under such extreme P concentrations.

Is more P always better then? Studies in tomatoes show better responses to salinity at higher P concentrations (for example here). Although the highest concentration tested here is 61 ppm (2mM) which is higher than but still close to what is generally used in hydroponic culture of tomato plants (30-50 ppm). Tabasco pepper has also been found to grow better under higher P concentrations (see here). A study varying P concentration in hob marjoram found lower essential oil concentrations at higher P levels, although these levels are around 60 ppm as well. Lettuce on the other hand shows increases of sesquiterpene lactones at high P levels (see here). There are a few publications about P toxicity in higher plants – notably this one about tomatoes – where problems caused by P are generally associated with the previously mentioned micronutrient issues and P concentrations in leaf tissue above 1%.

In summary P toxicity depends heavily on plant type and its ability to regulate P uptake, it is also most likely heavily dependent on micronutrient concentration and the strength and stability of the chelating agents used to prevent the precipitation of heavy metal phosphates. There are no studies I could find with P under very high concentrations (>=20mM) using chelated heavy metal sources so this is an interesting topic for research for anyone interested in exploring the limits of P uptake.


Hydroponic micro and macro nutrient sufficiency ranges

When you want to prepare a nutrient solution one of the first things you want to know is which concentration ranges are appropriate for the growth of the specific plant specie you want to cultivate. You will definitely want to make sure that you do not feed either too much or too little of any of the essential nutrients a plant requires. Lucky for you there is a ton of research surrounding what we call “sufficiency ranges” in hydroponic culture. The sufficiency range of a nutrient is simply the range of concentration where a plant does not show a toxicity or a deficiency but develops in a normal manner. On this blog post we will talk about the different sufficiency ranges that are provided across the scientific literature and what they tell us about plant nutritional needs.

The first thing to be clear about is that there is no single “sufficiency range” table. There have been many people who have worked on this subject using different plants and each one of them will tell you that the sufficiency range is slightly different. The above hydroponic nutrient concentration table shows you the minimum, optimal and maximum nutrient values that were determined by the Canadian ministry of Food and Agriculture using NFT systems. These requirements were determined for flowering plants – mainly tomatoes – reason why you can see the optimum Ca range at 150-300 and the optimum K range at 300-500. Also notice the very high optimal Fe requirement of 6 ppm. This is almost certainly using either a form of unchelated Fe or an Fe chelate that is not so stable in the hydroponic conditions under study. The sufficiency range of micro-nutrients also depends on exactly what form of the micro nutrients you use since some forms are absorbed much  more efficiently than others (it’s not the same to have 3 ppm of simple Fe+2 or 3ppm of FeEDDHA).

In general you’ll see that micro-nutrient sufficiency ranges have the most disparity between different sufficiency range tables. This is mainly because both the form of the micro nutrient and the specific cultivation media play a huge role in determining sufficient and toxic levels in hydroponic culture. For example a media like peat moss will contain a far greater amount of micro-nutrients than something like say, rockwool, so it is very important to account for media contributions when assessing micro-nutrient sufficiency ranges. While plants require so much macro nutrients that the sufficiency ranges are fairly coherent between different studies in the case of the micro nutrients the media choice itself could provide the entire requirement of a micro-nutrient through the plant’s growth cycle.

The second image shows another sufficiency range table for hydroponic nutrients. This time we can see the source salts being used. As you can see we have a fairly good agreement in the macro-nutrients – with perhaps the exception of the ammonium minimum being set at zero – but in the case of the micros we see that the recommended amount of Fe is actually 3 ppm instead of the 6 ppm that were recommended before. This is most probably because in this case some percentage of this was given as FeEDDHA, which is much more effectively absorbed than either unchelated Fe sources or Fe EDTA. The boron range is exactly the same and this is undoubtedly because boron is always supplied in the same manner in hydroponic crops, therefore its sufficiency range tends to be coherent as long as the same plant specie is used for determination.

Macro nutrient suggestions are also not free from variations. Depending on the method used to determine the sufficiency range there can also be differences. The table below shows you yet another sufficiency range table which was geared towards maximum yields in terms of product weight. In this case You can see optimum K concentrations in the 50-200 range which is confusing given that the two tables before had suggested a much higher range of 300-500 ppm. Who is right here then? Do plants require 300-500 ppm of K for optimum growth or can they do fine with 50-200?

 –

The answer is that both can be right. Under some growing systems plants might require the solution to have more K because the setup might make K absorption harder while in other setups you might want to have lower K. This sort of contradiction surfaces constantly in hydroponic nutritional studies, simply because the variability in the subject of study (yields of a certain plant) will tend to vary very significantly depending on exactly which plant is grown and under which conditions. Just the plant and its development phase can make a huge difference in what has actually been found to work better.

Checkout for example the Israeli service recommendations for growing three different plants across their life cycle. You can see that the amount of nutrients they use can be different from what we have learned before. In this case their recommendations for all plants fall within the sufficiency ranges in the previous table but notice how for strawberry plants we use a potassium level that is at most 90 ppm while for tomatoes we go as high as 250 ppm within the fruit ripening stage. Also notice how in the case of sweet peppers the P can go as high as 150 ppm while for tomatoes we always stay within the 30-40 ppm range. If we had followed the previous recommendations we would have never considered something like a 150 ppm of P to be an acceptable value for this element, since all of these sufficiency range studies point to the optimum P being 50 ppm. However a sweet pepper is not a tomato. In the same way that a house cat isn’t a tiger.

So although sufficiency range tables are good to determine starting points, you should be well aware that these tables need to be considered in the context in which they were created. The plant used, the exact nutrient salts used and the growing system can all play significant roles that may cause two sufficiency studies to tell you very different things. In the end the best thing that can be done is to use the values for the plant that is taxonomically closest to the one you want to study in the system that resembles your system the most and then go from there to establish what the best values are in your particular case.