My Kratky tomato project, tracking a Kratky setup from start to finish

Fully passive, hydroponic setups are now everywhere. However, it seems no one has taken the time to diligently record how the nutrient solution changes through time in these setups and what problems these changes can generate for plant growth. In my Kratky tomato project, I will be closely monitoring a completely passive Kratky setup from start to finish. In this post, I will describe how this project will work, what I will be recording, and what I’m hoping to achieve. Check out the youtube video below for an initial intro to this project.

Introduction video for this Kratky project.

The goals

It is tough to grow large flowering plants using truly passive Kratky setups (read my blog post on the matter). We know this is because of issues related to their increased water uptake and the large nutrient and pH imbalances these plants create in nutrient solutions. However, I haven’t found any data set that shows how these problems develop as a function of time. By measuring different variables in a Kratky setup through an entire crop cycle, I hope to gather data to help us understand what goes wrong, why it goes wrong and when it goes wrong. With this information, we should be able to develop better nutrient solutions and management techniques, for more successful Kratky hydroponic setups for large flowering plants.

The setup

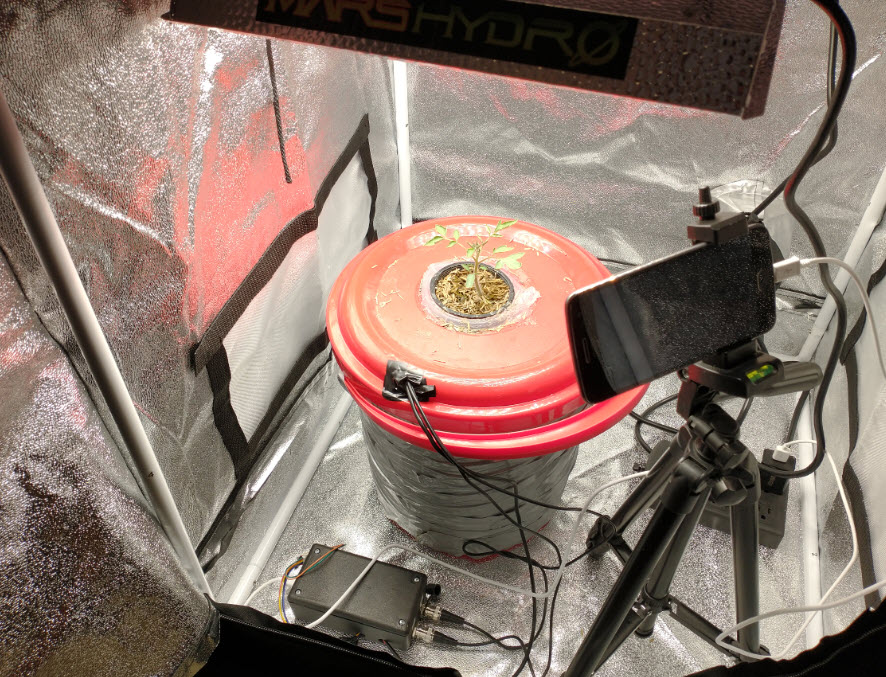
The setup is a 13L bucket wrapped in duct tape – to prevent light from entering the system – with a hole at the top and a net pot containing a tomato plant. The tomato – which I have named Bernard – is an indeterminate cherry tomato that was germinated in the net pot. The net pot contains a medium consisting of 50% rice hulls and 50% river sand. The bucket has been filled with a store-bought generic hydroponic nutrient solution up to the point where it touches the bottom of the net pot. Furthermore, the bucket is placed inside a grow tent and receives 12 hours of light from a Mars Hydro TS 600 Full Spectrum lamp. The light has been initially placed around 10 inches above the plant and will be moved as needed to maintain proper leaf temperature and light coverage of the plant.

The experimental Kratky setup. You can see the project box housing the Arduino and sensor boards at the bottom. Bernard has been growing for 2 weeks and is already showing its second set of true leaves.

The measurements

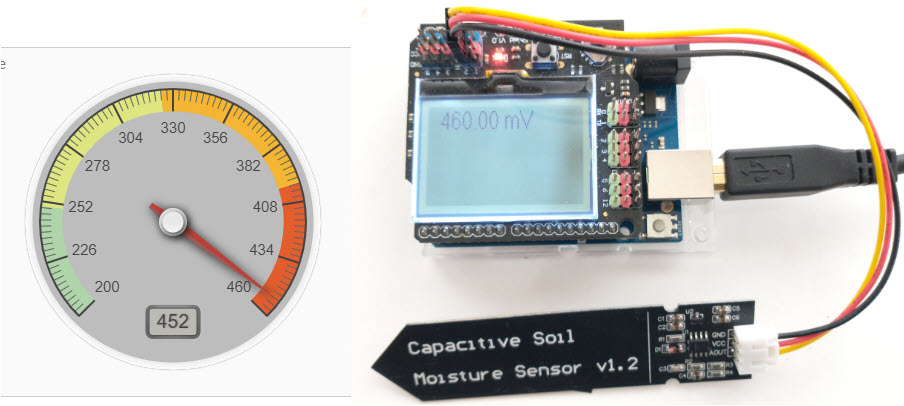
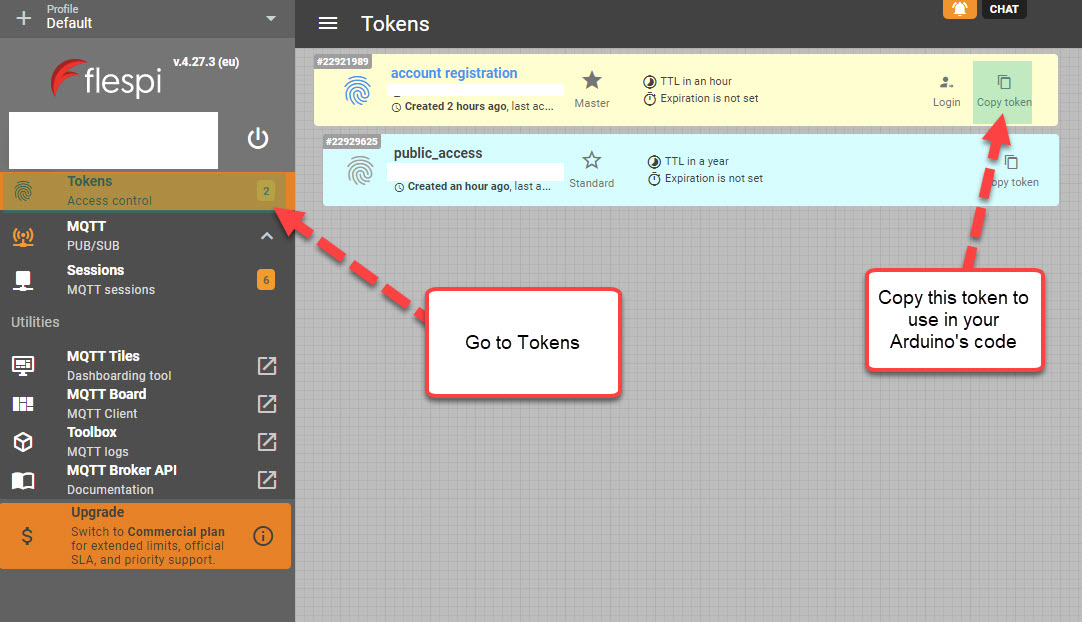
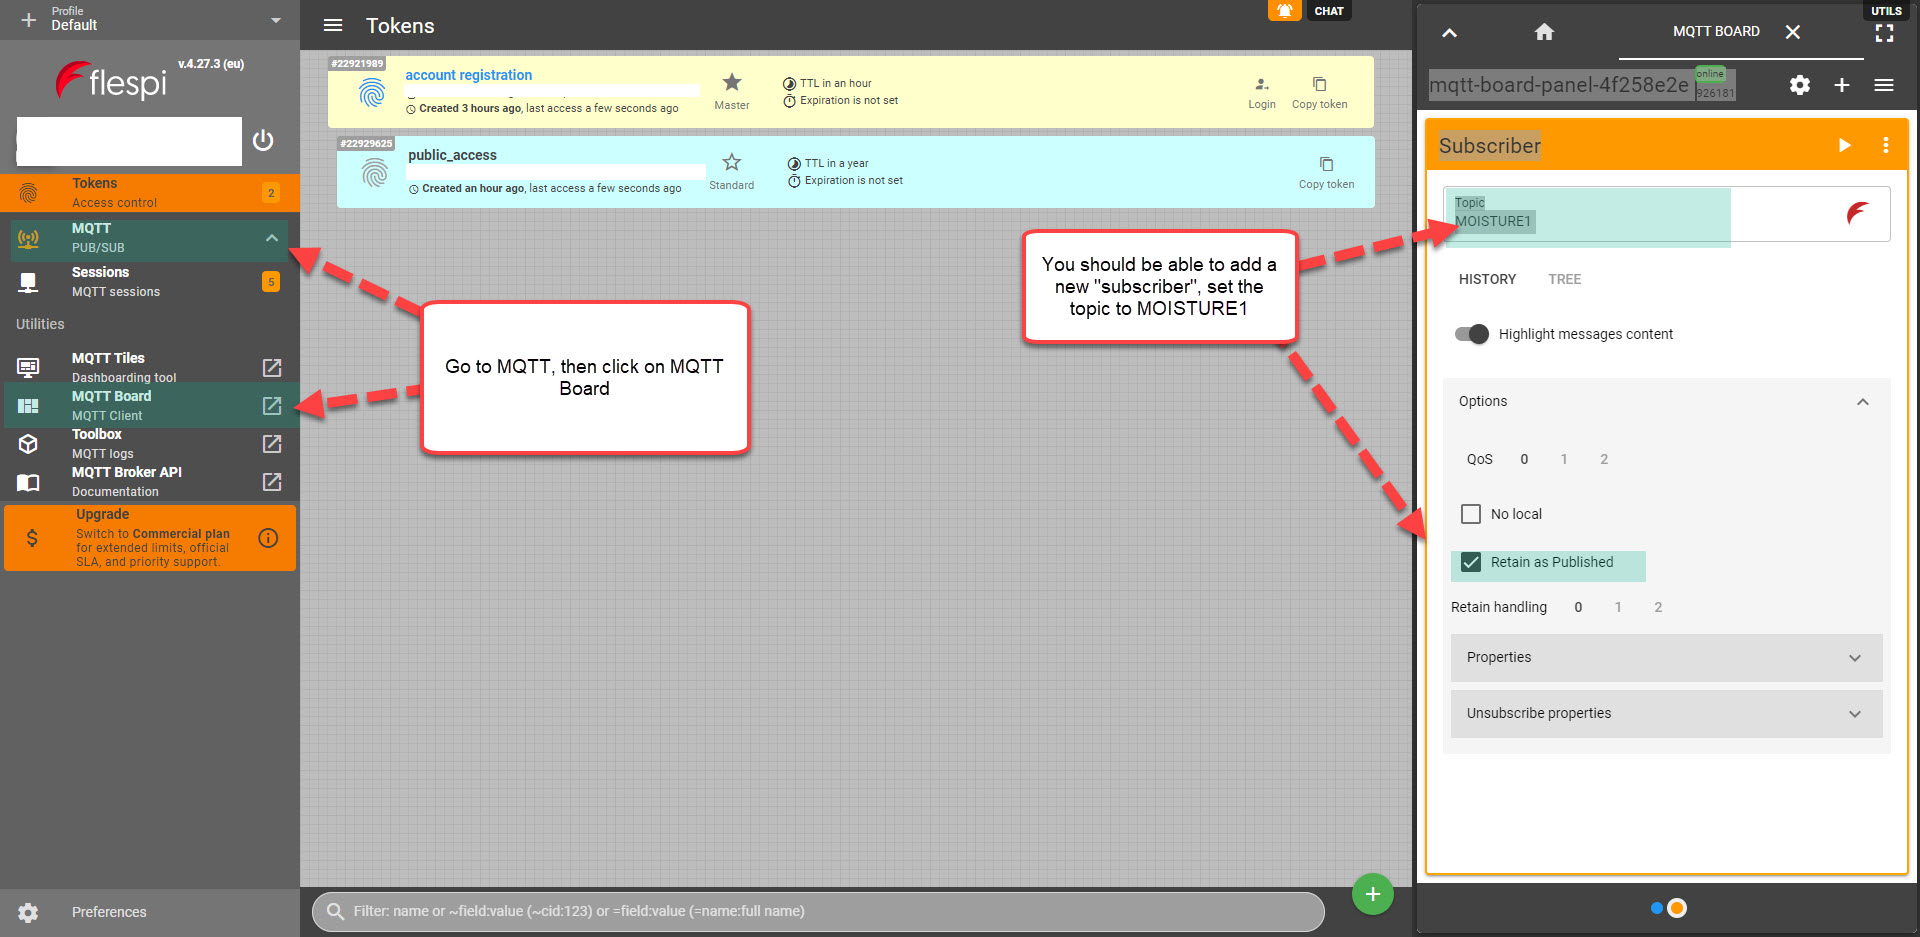
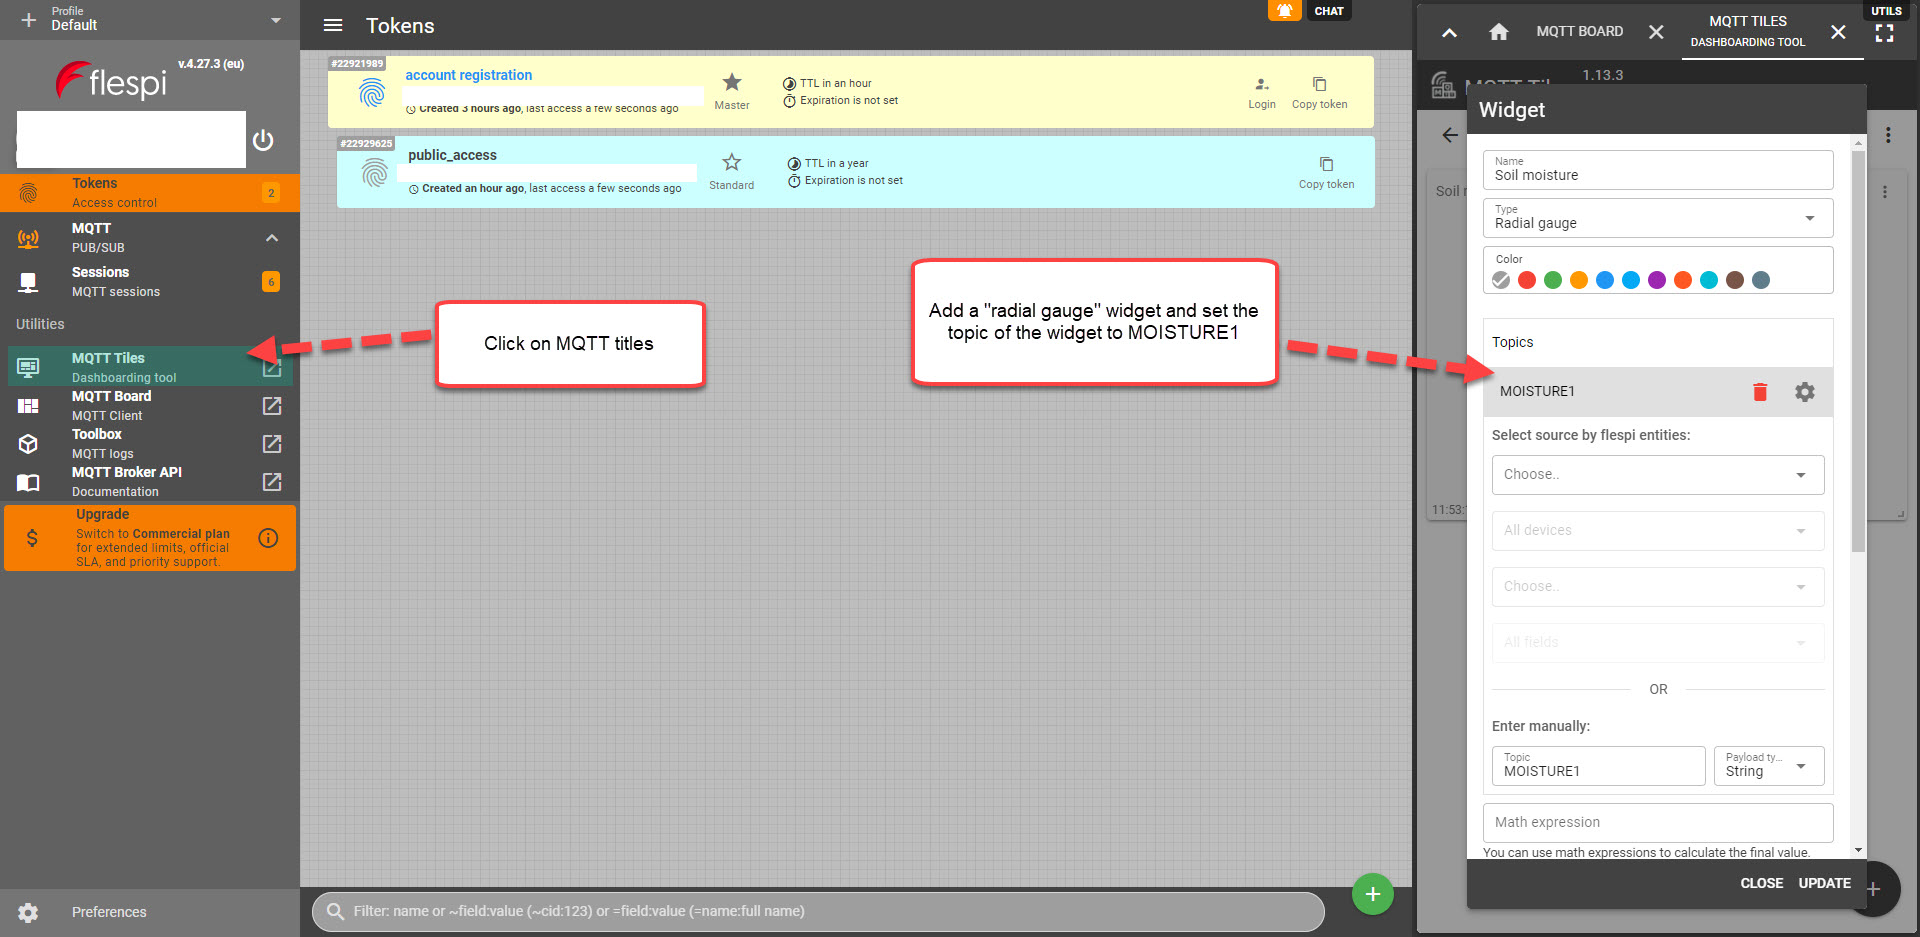
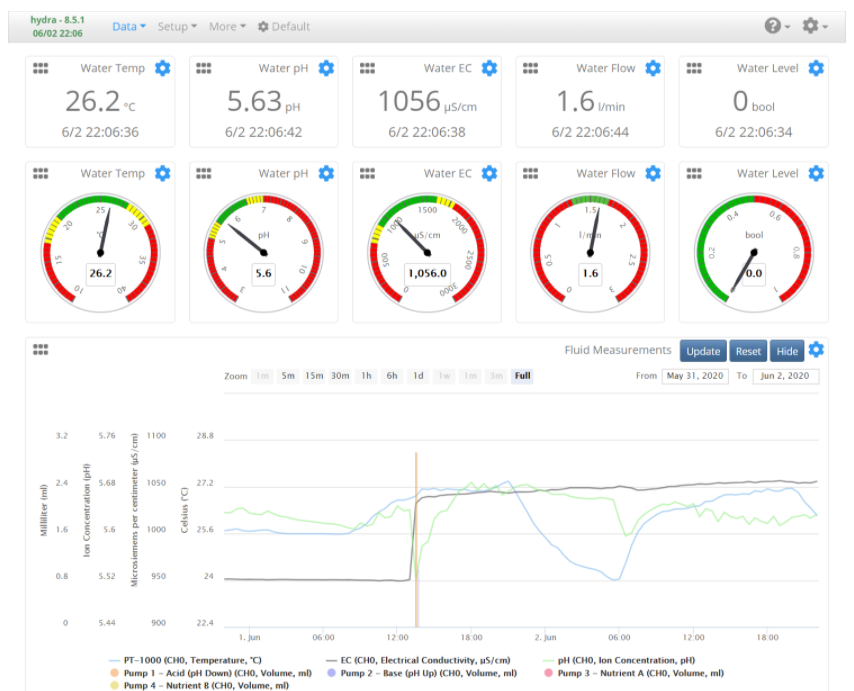
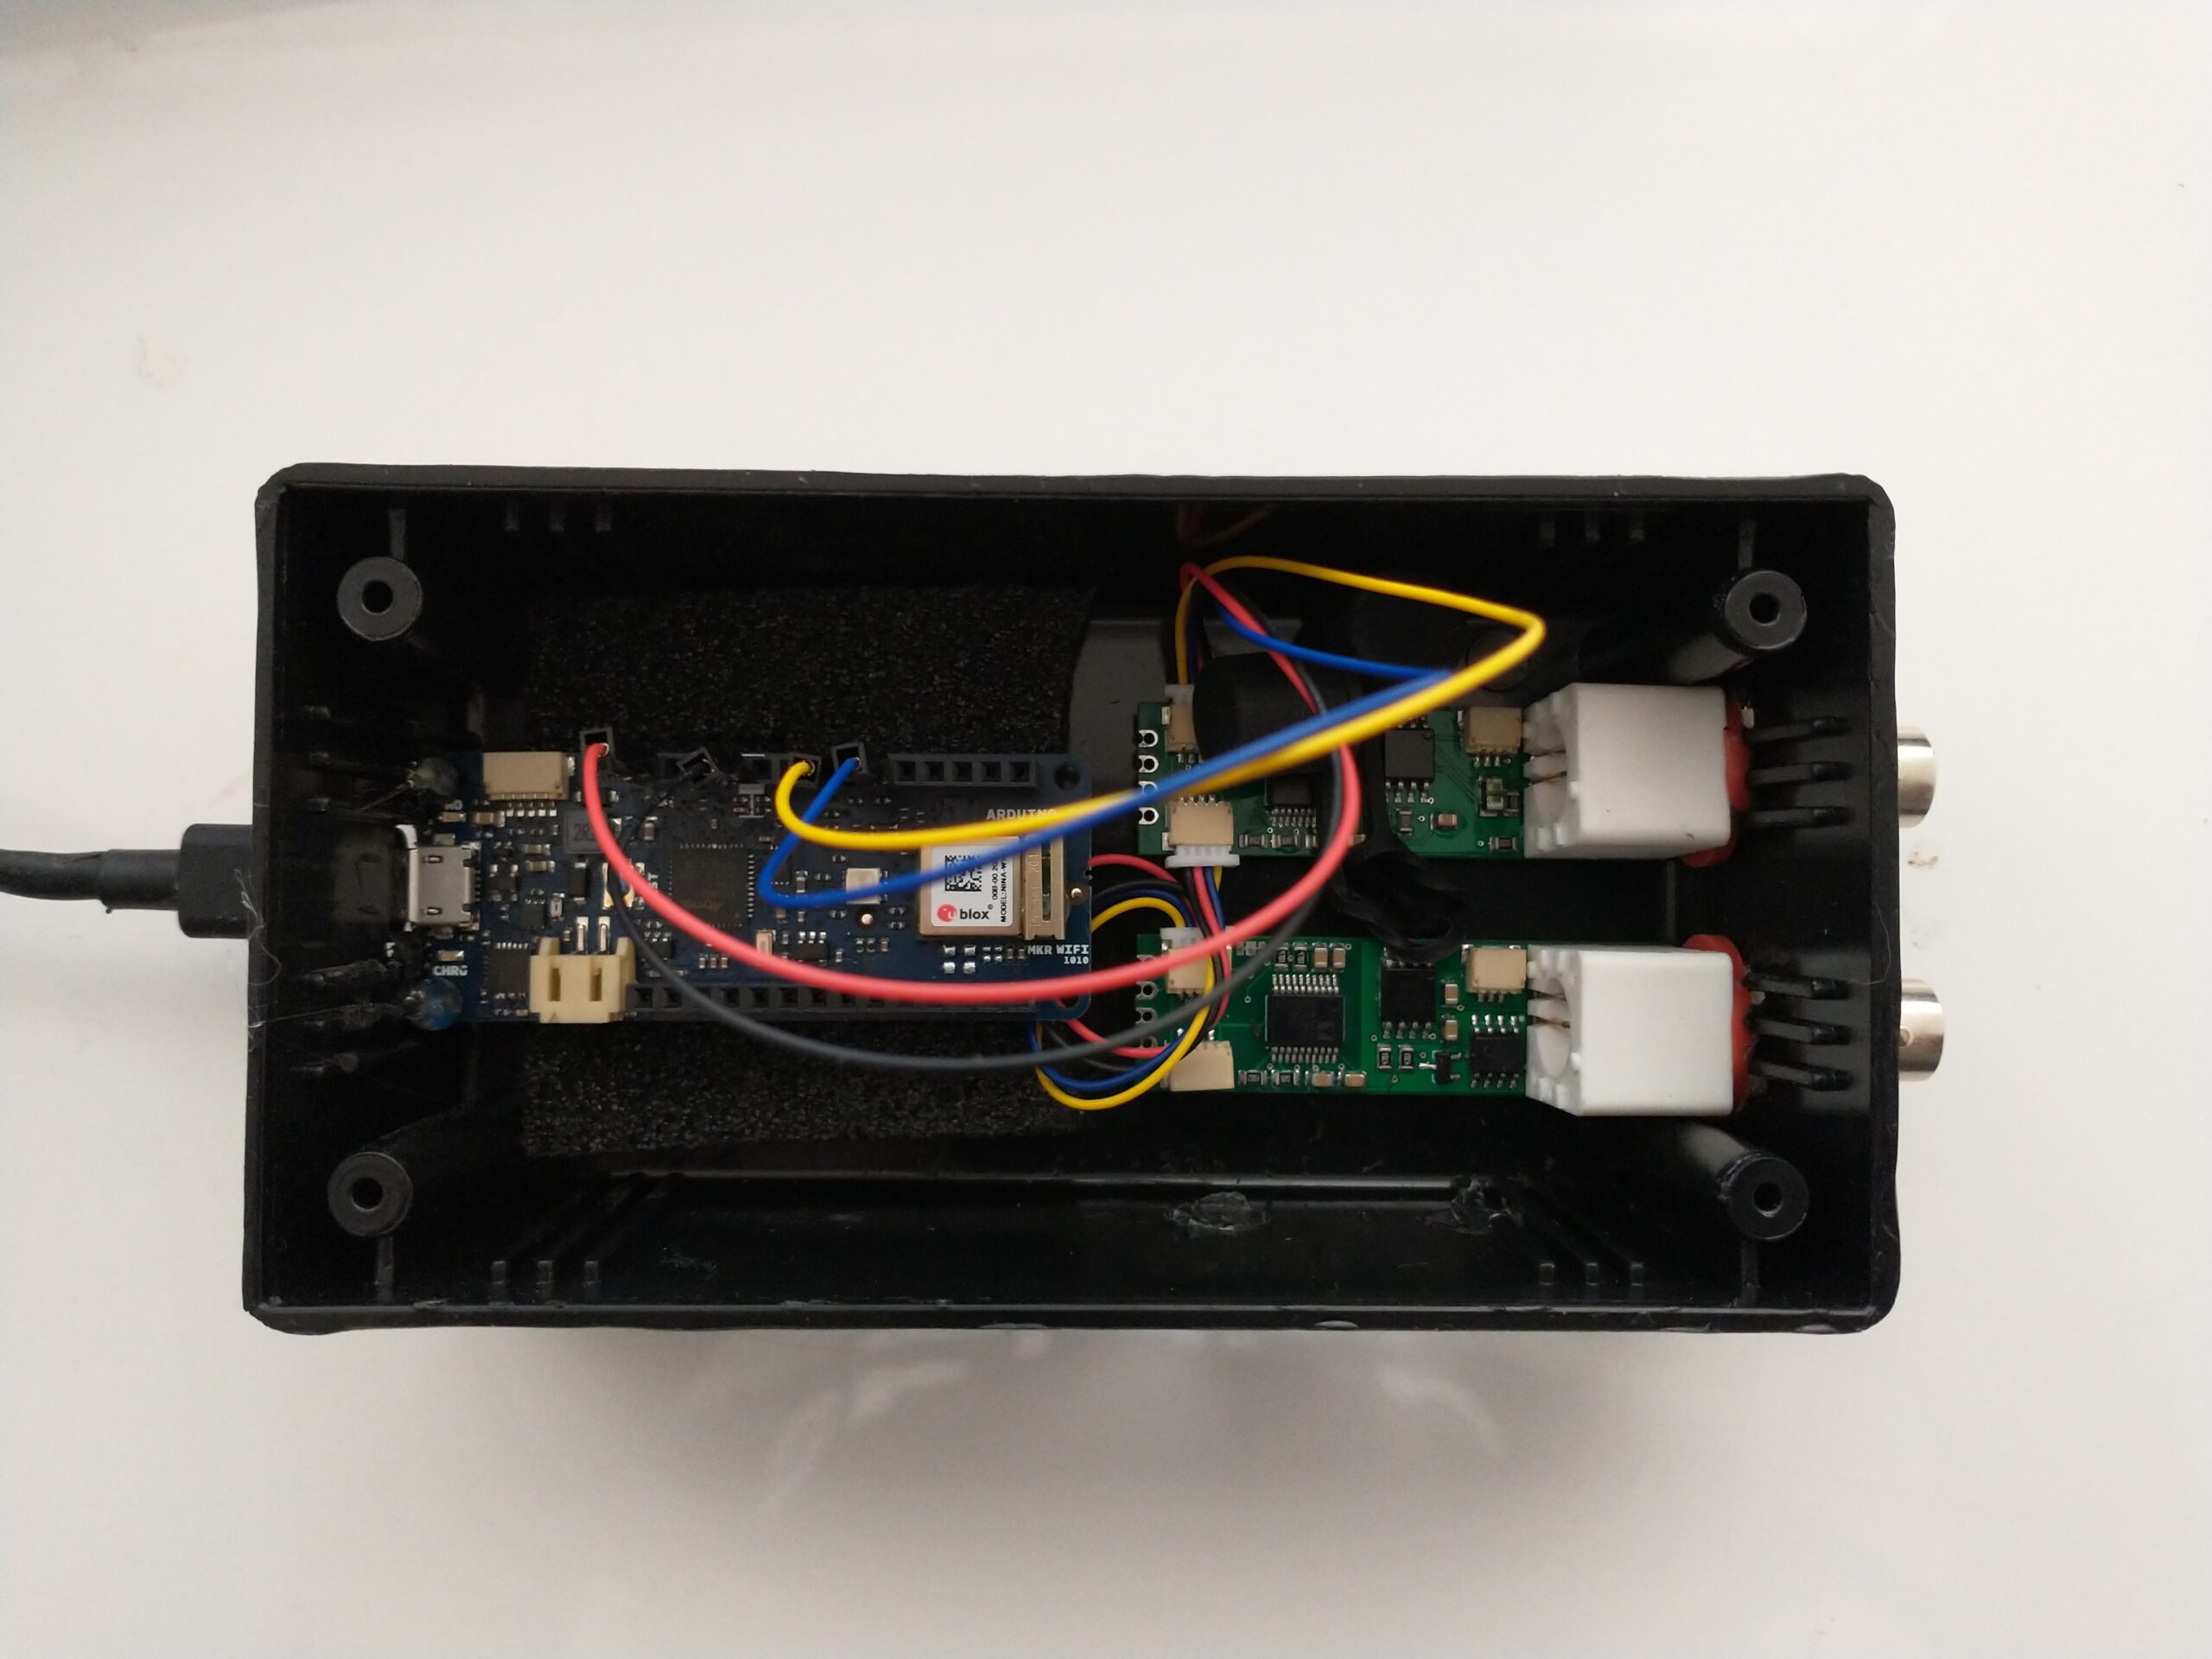
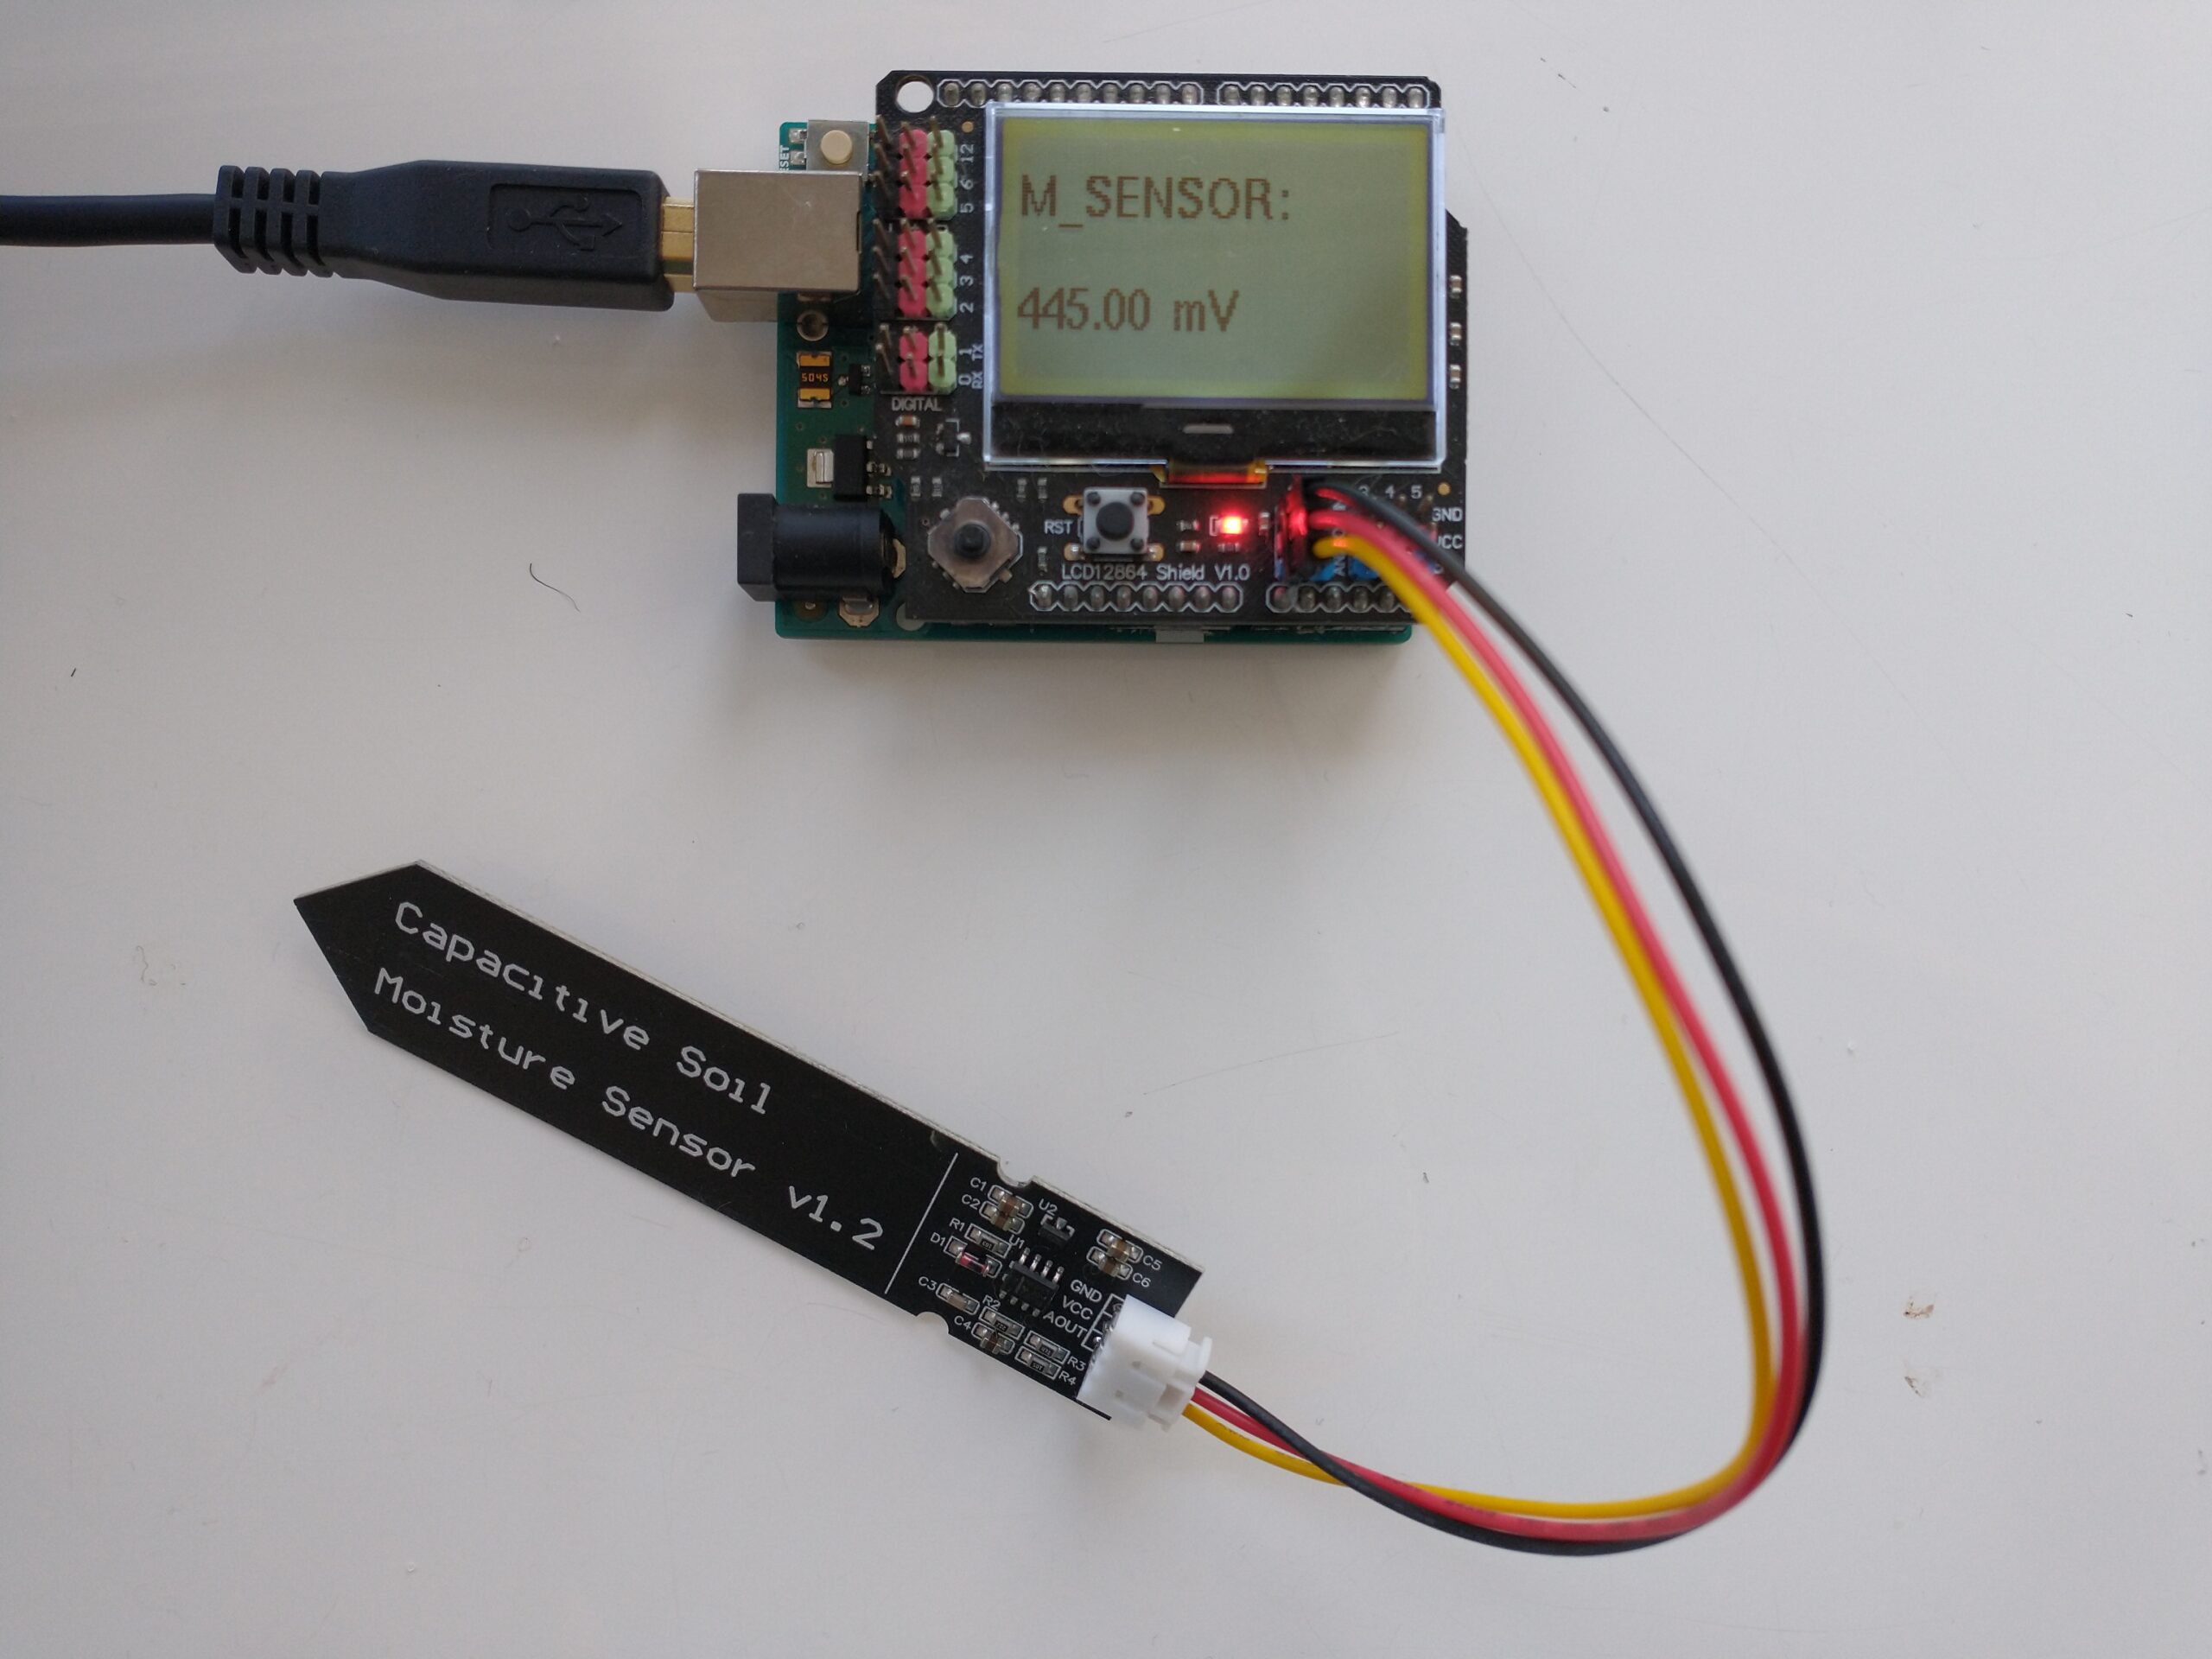
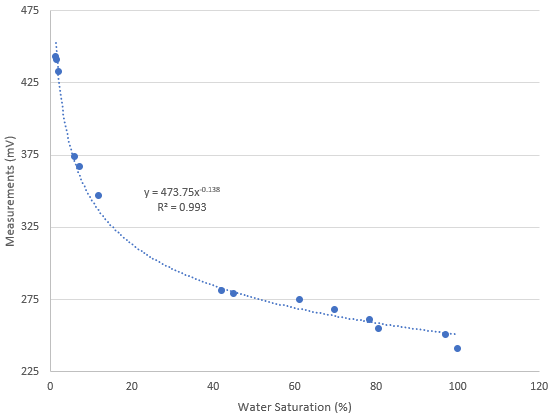
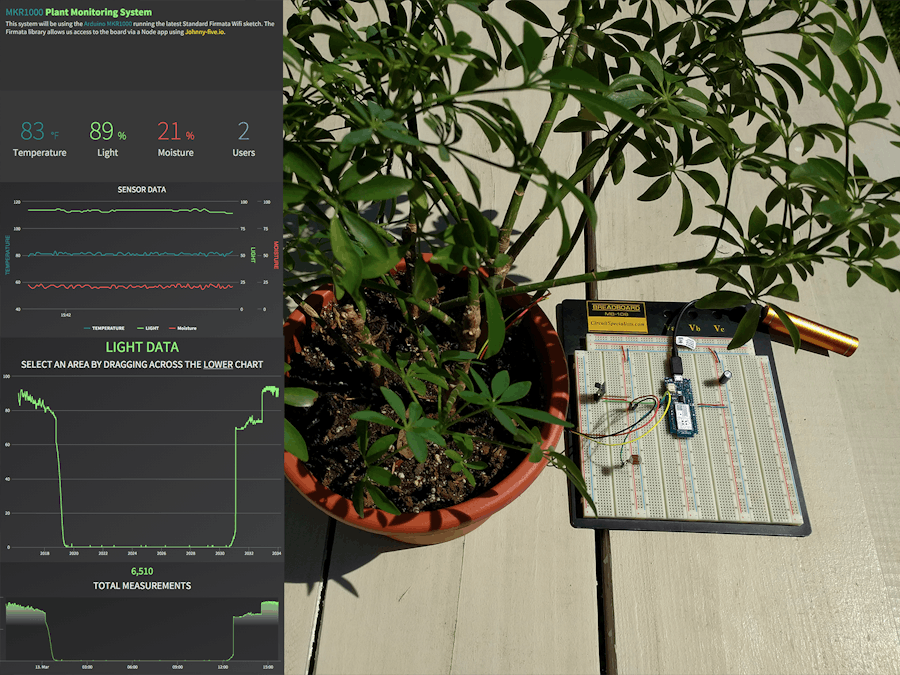
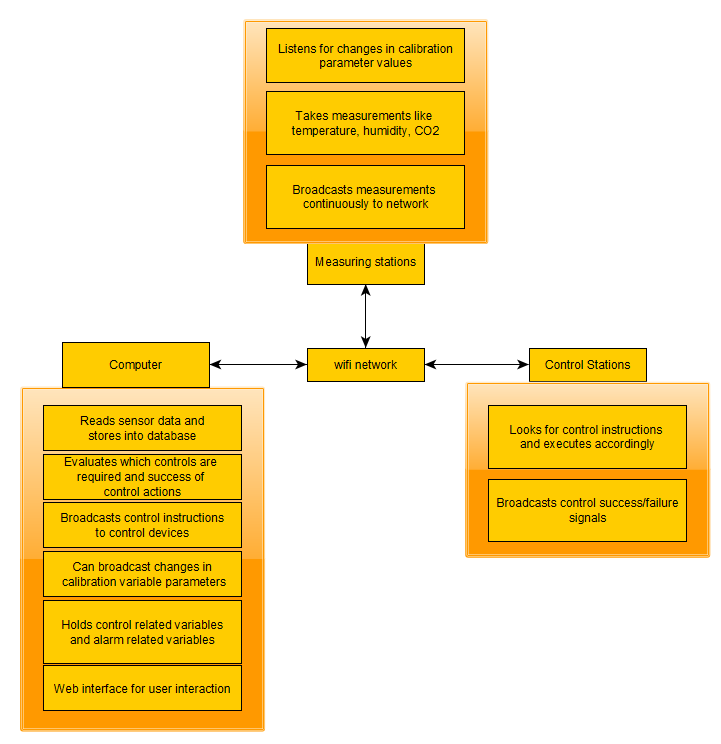
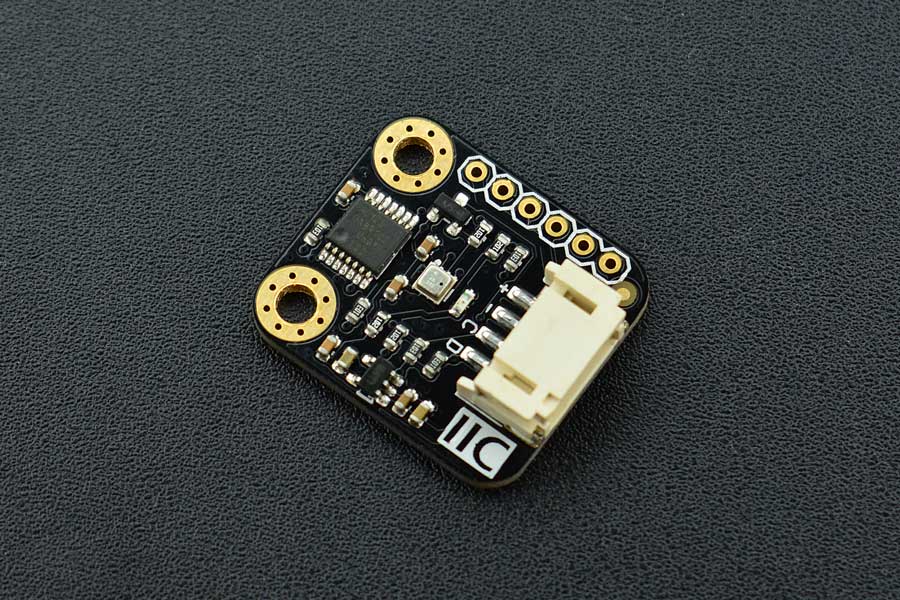
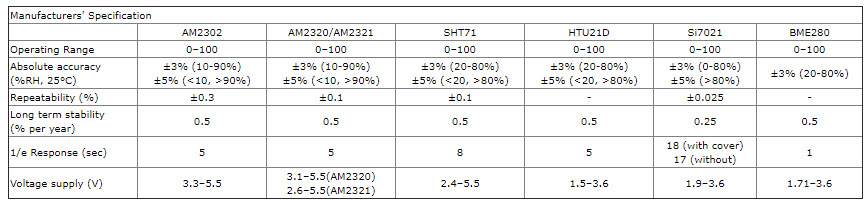
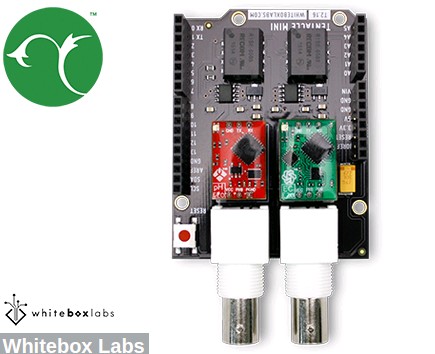
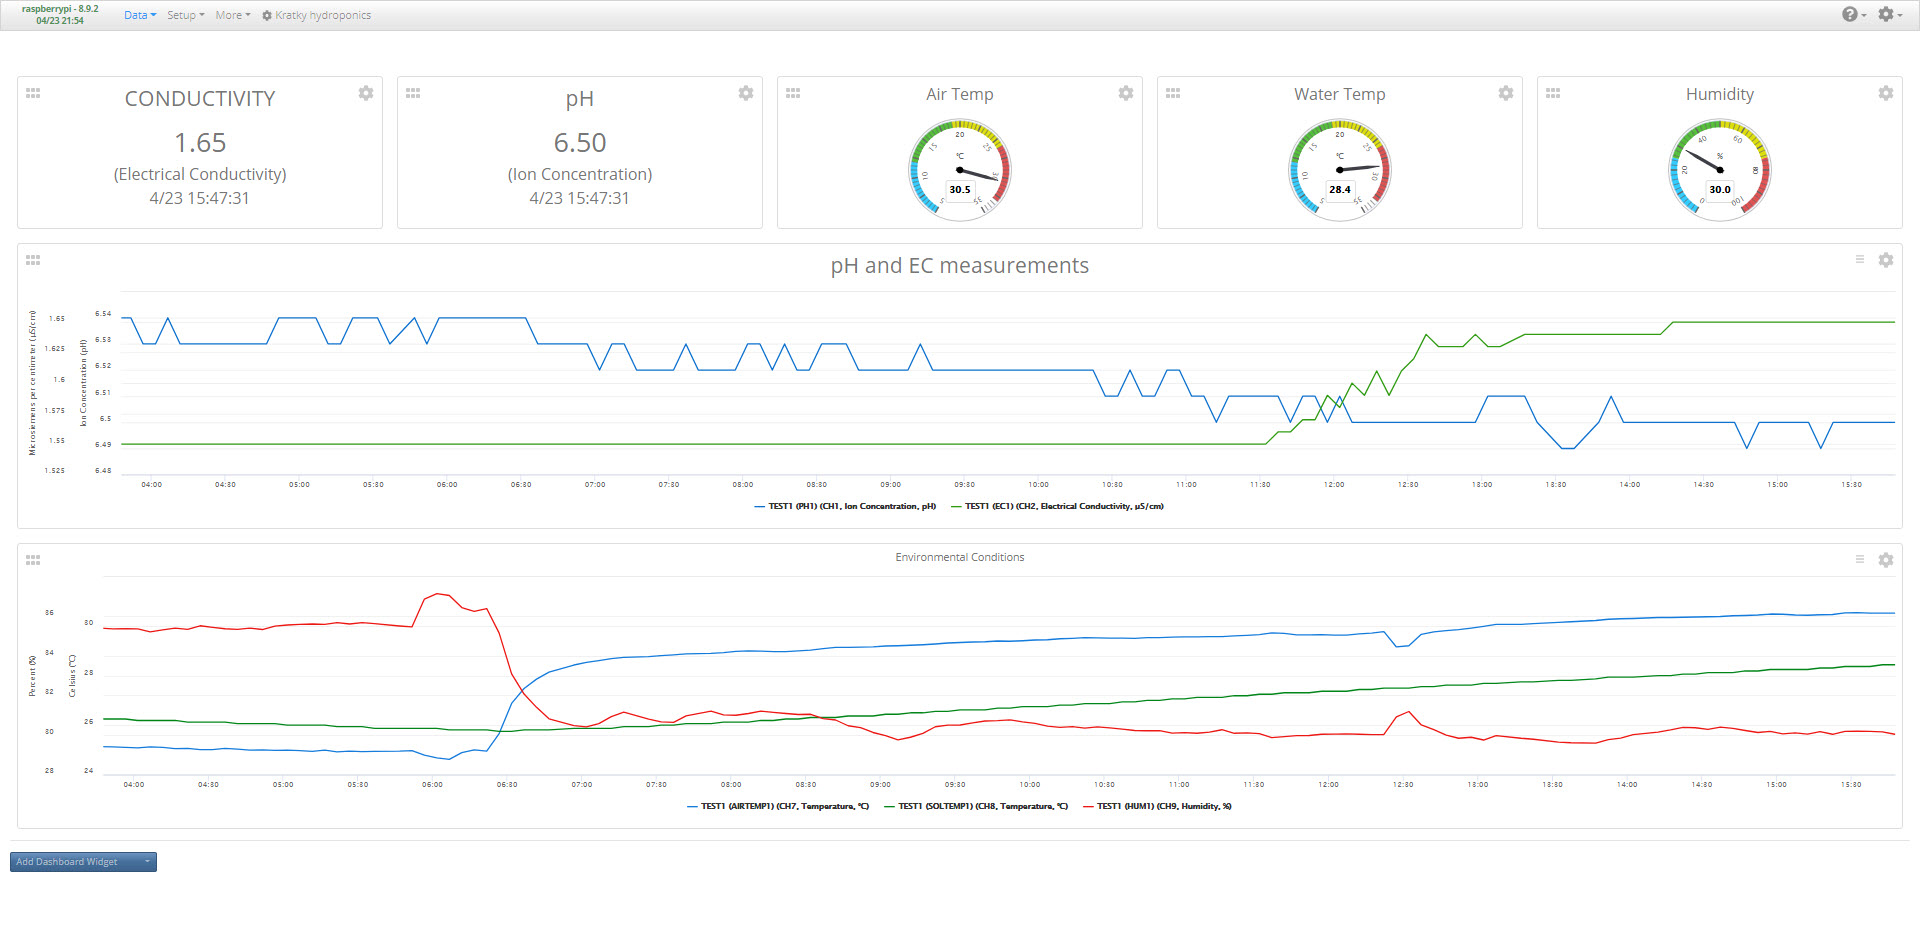
I will be monitoring as many variables as I can within this experiment. To do this I have set up an Arduino MKR Wifi 1010 that uses self-isolated uFire pH and EC probes, a BME280 sensor to monitor air temperature and humidity, and a DS18B20 sensor to monitor the temperature of the solution. I will also be using Horiba probes to track the Nitrate, Potassium, and Calcium concentrations once per day. All the Arduino’s readings are being sent via Wifi to a MyCodo server in a Raspberry Pi, using the MQTT messaging protocol. The data is then recorded into the MyCodo’s database and also displayed in a custom dashboard. The ISE measurements are manually recorded on a spreadsheet.

The dashboard of my MyCodo server, showing the measurements of the system as a function of time. All readings are also recorded in the MyCodo database for future reference and processing.

Furthermore, I am also taking photographs every 15 minutes – when the lights are on – using a smartphone. This will allow me to create a time-lapse showing the growth of the plant from the very early seedling to late fruiting stages.

Conclusion

I have started a new project where I will fully record the complete development process of a large flowering plant in a Kratky setup. We will have information about the EC and pH changes of the solution, as well as information about how different nutrient concentrations (N, K and Ca) change through the life of the plant. With this information, we should be able to figure out how to modify the nutrient solution to grow large flowering plants more successfully, and what interventions might be critical in case fully passive growth is not possible.

I will continue to share updates of this project in both my blog and YouTube channel.

What do you think about this project? Do you think Bernard will make it? Let us know in the comments below!


Arduino hydroponics, how to build a sensor station with an online dashboard

In a previous post about Arduino hydroponics, I talked about some of the simplest projects you could build with Arduinos. We also talked about how you could steadily advance towards more complex projects, if you started with the right boards and shields. In this post, I am going to show you how to build a simple sensor station that measures media moisture and is also connected to a free dashboard platform (flespi). The Arduino will take and display readings from the sensor and transmit them over the internet, where we will be able to monitor them using a custom-made dashboard. This project requires no proto-boards or soldering skills.

An Arduino Wifi Rev2 connected to a moisture sensor, transmitting readings to an MQTT server hosted by flespi that generates an online dashboard

The idea of this project is to provide you with a simple start to the world of Arduino hydroponics and IoT interfacing. Although the project is quite simple, you can use it as a base to build on. You can add more sensors, improve the display, create more complicated dashboards, etc.

What you will need

For this build, we are going to use an Arduino Wifi Rev2 and an LCD shield from DFRobot. For our sensor, we are going to be using these low-cost capacitive moisture sensors. This sample project uses only one sensor, but you can connect up to five sensors to the LCD shield. Since this project is going to be connected to the internet, it requires access to an internet-connected WiFi network.

Additionally, you will also need a free flespi account. Go to the flespi page and create an account before you continue with the project. You should select the MQTT option when creating your account since the project uses the MQTT protocol for transmission. After logging into your account, copy the token shown on the “Tokens” page, as you will need it to set up the code.

Copy the token from the “Tokens” menu in flespi

Libraries and code

This project uses the U8g2, ArduinoMQTTClient and WiFiNINA libraries. You should install them before attempting to run the code. The code below is all you need for the project. Make sure you edit the code to input your WiFi SSID, password, and Flespi token, before uploading it to your Arduino. This also assumes you will connect the moisture sensor to the analogue 2 port of your Arduino. You should change the ANALOG_PORT variable to point to the correct port if needed.

#include <Arduino.h>
#include <U8g2lib.h>
#include <WiFiNINA.h>
#include <ArduinoMqttClient.h>
#include <SPI.h>

#define SECRET_SSID "enter your wifi ssid here"
#define SECRET_PASS "enter your password here"
#define FLESPI_TOKEN "enter your flespi token here"
#define ANALOG_PORT  A2

#define MQTT_BROKER    "mqtt.flespi.io"
#define MQTT_PORT      1883

U8G2_ST7565_NHD_C12864_F_4W_SW_SPI u8g2(U8G2_R0, /* clock=*/ 13, /* data=*/ 11, /* cs=*/ 10, /* dc=*/ 9, /* reset=*/ 8);
float capacitance;
WiFiClient wifiClient;
MqttClient mqttClient(wifiClient);

// checks connection to wifi network and flespi MQTT server
void check_connection()
{
  if (!mqttClient.connected()) {
    WiFi.end();
    WiFi.begin(SECRET_SSID, SECRET_PASS);
    delay(10000);
    mqttClient.setUsernamePassword(FLESPI_TOKEN, "");
    if (!mqttClient.connect(MQTT_BROKER, MQTT_PORT)) {
      Serial.print("MQTT connection failed! Error code = ");
      Serial.println(mqttClient.connectError());
      delay(100);
    }
  }
}

void setup() {
  pinMode(LED_BUILTIN, OUTPUT);
  pinMode(4, OUTPUT);
  Serial.begin(9600);
  analogReference(DEFAULT);
  check_connection();
}

void loop() {

  String moisture_string;
  check_connection();

  // read moisture sensor, since this is a wifiRev2 we need to set the reference to VDD
  analogReference(VDD);
  capacitance = analogRead(ANALOG_PORT);
  
  // form the string we will display on the Arduino LCD screen
  moisture_string = String(capacitance) + " mV";
  Serial.println(moisture_string);
  
  // send moisture sensor reading to flespi
  mqttClient.beginMessage("MOISTURE1");
  mqttClient.print(capacitance);
  mqttClient.endMessage();

  // the LCD screen only works if I reinitialize it on every loop
  // I also need to reset the analogReference for it to properly work
  analogReference(DEFAULT);
  u8g2.begin();
  u8g2.setFont(u8g2_font_crox3h_tf); 
  u8g2.clearBuffer();          // clear the internal memory
  u8g2.drawStr(10,15,moisture_string.c_str());  // write something to the internal memory
  u8g2.sendBuffer();          // transfer internal memory to the display

  delay(5000);
  
}

Your Arduino should now connect to the internet, take a reading from the moisture sensor, display it on the LCD shield and send it to flespi for recording. Note that the display of the data on the LCD shield is quite rudimentary. This is because I didn’t optimize the font or play too much with the interface. However, this code should provide you with a good template if you want to refine the display.

Configure Flespi

The next step is to configure flespi to record and display our readings. First, click the MQTT option to the left and then go into the “MQTT Board” (click the button, no the arrow that opens up a new page). Here, you will be able to add a new subscriber. A “subscriber” is an instance that listens to MQTT messages being published and “MOISTURE1” is the topic that our Arduino will be publishing messages to. If you want to publish data for multiple sensors, you should give each sensor its own topic, then add one flespi subscriber for each sensor.

Go to flespi and create a new “subscriber”, set the topic to MOISTURE1

Create the Dashboard

The last step, is to use the “MQTT Titles” menu to create a dashboard. I added a gauge widget to a new dashboard, and then set the topic of it to MOISTURE1, so that its data is updated with our MQTT messages. I set the minimum value to 200; the maximum value to 460; and the low, mid, and high levels to 250, 325, and 400 respectively.

Use the MQTT titles menu to add widgets to a new dashboard

After you finish creating the dashboard, you can then use the “Get link” button, which looks like a link from a chain next to your dashboard’s title. You will need to create an additional token in the “Tokens” menu so that you can use it for the sharing of the dashboard. After you generate the link, it should be publicly available for anyone who is interested. This is the link to the dashboard I created.

Conclusion

You can create a simple and expandable sensor station using an Arduino Wifi Rev2, a capacitive moisture sensor, and an LCD shield. This station can be connected to the internet via Wifi and send its data to flespi, which allows us to create free online dashboards. You can expand on this sensor station by adding more moisture sensors or any other Gravity shield compatible sensors, such as a BME280 sensor for temperature, humidity, and atmospheric pressure readings.


Arduino hydroponics, how to go from simple to complex

Hydroponic systems offer a great opportunity for DIY electronics. In these systems, you can monitor many variables, gather a lot of data, and build automated control systems using this information. However, the more advanced projects can be very overwhelming for people new to Arduinos and the simpler projects can be very limiting and hard to expand on if you don’t make the right decisions from the start. In this post, I’m going to talk about the easiest way to start in Arduino hydroponics, which materials and boards to buy, and how to take this initial setup to a more complex approach with time.

The Arduino Wifi Rev2

Buy the right Arduino

First, buy an Arduino that allows you to build simple projects without compromising your ability to upgrade in the future. My recommendation would be an Arduino Wifi Rev2. These are small boards that are compatible with Arduino Uno shields, with the ability to connect to your network when you’re ready for more complex projects. Shields are boards that can be stacked on top of your Arduino, which allow you to get additional functionality or simplify the usage of the board. The Arduino Wifi Rev2 is a perfect choice, as you can outgrow simpler boards quickly while the more complicated ones are likely to be overkill and limit your potential shield choices.

Avoid soldering and protoboards, go for plug-and-play

For people new to Arduino, it is easier to avoid sensors that require soldering or protoboards and go with plug-and-play approaches. My all-time favorite is the “Gravity” system created by DFrobot, which uses shields that expose quick access connectors that you can use to plug-in sensors. My recommendation is the LCD12864 Shield, which has an LED and allows you to connect both analog and digital sensors. If you buy any “Gravity-compatible” sensor, you will only need to hook up a connector, no soldering or protoboards involved. You also have a graphic interface you can program and buttons you can use to interact with your Arduino and code.

The LCD12864 Gravity shield that exposes easy plug-and-play ports for sensors

Start with a temperature/humidity display station

A good beginner project is to create a monitoring station that displays the readings from sensors on a screen. I’ve written about how to build such a station in a previous blog post. However, since pH and EC sensors can be more complicated, it is easier to start with temperature/humidity sensors only. There are several cheap sensors of this kind, such as the DHT11 and DHT22 sensors, but these have important issues. A better choice for hydroponics is the SHT1x sensor. If you are more advanced, the BME280 sensors are now my low-cost sensor of choice. There are lots of gravity sensors to choose from. You can also monitor CO2, light intensity, solution temperature, EC, pH, and other variables as you become more advanced.

Sensor de Humedad y Temperatura SHT1x Gravity - RobotShop
The SHT1x Gravity sensor, this can be easily plugged into the LCD12864 shield shown before

When you go into EC/pH monitoring, make sure you buy sensors that have electrically isolated boards. The ones from DFRobot are not electrically isolated and have important issues when multiple probes are put in the same solution. Most cheap ones on eBay/Amazon, have the same issues. I would recommend the sensors boards from uFire, which have a lower cost, are properly isolated, and are easy to use. The hydroponic kit collection, offers all the sensors and boards you require, in rugged industrial quality configurations, to build a hydroponic monitoring station.

Next step, simple control

The next step in complexity is control. You can use a Gravity relay to switch a light or timer on or off. You can also use a simple dead-band algorithm to attempt to control your temperature and humidity values by using relays to turn humidifiers, dehumidifiers, or AC systems on or off. If you want to control nutrients and pH, this is also where you would get shields to run stepper motors and the peristaltic pumps required to feed solutions into a tank. I’ve used this shield stacked under an LCD12864 for this purpose.

As an example of simple control, imagine your humidity is getting too high, so you install a dehumidifier to keep your humidity from climbing above 80%, you then create a line of code that sets the relay to “on” whenever the humidity gets higher than 80% and shuts it down whenever it drops below 75%. That way your crop’s humidity increases to 80%, the dehumidifier kicks in, and then it shuts down when it reaches 75%. This allows the setup to climb back up for some time, avoiding the continuous triggering of your appliance.

Data Logging

After you’re comfortable with both monitoring setups and simple control, the next step is data logging. Up to this point, none of your setups have done any data logging. By its very nature, an Arduino is not built to log any data, so this will require interactions with computers. My favorite way to do this is to set up a MyCodo server on a Raspberry Pi, then transmit data to it using the MQTT protocol. Since your Arduino Wifi v2 can connect to your Wifi network, you will be able to transmit data to your MyCodo using this configuration.

A sample of the data-logging capabilities of a MyCodo server. Taken from the MyCodo site.

I have previously written posts about MyCodo, as well as how to build a pH/EC wireless sensing station that transmits data to a MyCodo server. This allows me to log data continuously and monitor it without having to go into my hydroponic crop. Since the server is centralized, it also allows you to monitor multiple sensing stations simultaneously. I use my MyCodo server to monitor both my hydroponic crops and Arduino sensing stations that monitor how much food my cats eat.

More complex control

After you have connected your Arduino to a MyCodo server, you have access to much more complicated control, through the Raspberry Pi computer. You can then implement control algorithms in the MyCodo, then communicate with your Arduino, and trigger actions using MQTT messages. This means that you no longer need to code the control logic into your Arduino but you can do all the control in the raspberry Pi and just communicate the decisions made to the Arduino Wifi Rev2.

More complicated algorithms includes the use of proper PID algorithms for the control of humidity, temperature, pH and EC. It also includes the implementation of reinforcement learning algorithms and other advanced control methods that the Raspberry Pi can have the capacity to run.

Conclusion

Arduino in hydroponics does not need to be complex. Your first project can be a simple temperature/humidity monitoring setup and you can evolve to more complicated projects as your understanding and proficiency grow. If you select a powerful and feature-rich Arduino from the start, you can use the same controller through all your different projects. If you select shields that can make your life easier – such as the LCD12864 shield – and use a plug-and-play sensor interface, you can concentrate on building your setup and your code, rather than on soldering, getting connections right, and dealing with messy protoboard setups.

The road from a simple monitoring station to a fully fledged automated hydroponic setup is a long one, but you can walk it in small steps.

Have you used Arduinos in your hydroponic setup? Let us know about your experience in the comments below!


Creating a pH/EC wireless sensing station for MyCodo using an Arduino MKR Wifi 1010

There are multiple open-source projects available online for the creation of pH/EC sensing stations for hydroponics. However, all of the ones I have found use a single Arduino or Raspberry Pi to perform the measurements and store any data, making them unsuitable for applications where more flexibility is needed. For example, a facility using multiple different reservoir tanks for nutrient storage might require multiple pH/EC sensing stations, and single-board wired setups would be unable to accommodate this without a lot of additional development. In this post, I am going to show you a simple pH/EC sensing station I built with an Arduino MKR Wifi 1010 that can communicate with a MyCodo server using the MQTT protocol. Multiple sensing stations could be built and all of them can communicate with the same MyCodo server.

My Arduino MKR wifi 1010 based sensing station, using uFire pH and EC boards in a small project box.

This project makes use of the small pH/EC boards provided by uFire, which have a lower cost compared to those provided by companies like Atlas, but do have adequate electrical isolation to avoid problems in readings when multiple electrodes are put in the same solution. This is a substantial improvement over other low-cost boards where using multiple probes can cause heavy electrical noise and interference. In order to build this project you will require the following materials:

Note, some of the links below are amazon affiliate links. This means that I get a small commission if you purchase through these links at absolutely no extra cost to you. The links to other websites are not affiliate links.

  1. Arduino MKR Wifi 1010
  2. uFire pH probe
  3. uFire EC probe
  4. A rugged pH probe with a VNC connector
  5. An rugged EC probe with a VNC connector
  6. Two Qwiic-to-Qwiic connectors
  7. One Qwiic-to-male connector
  8. A project box to put everything inside (optional)
  9. A micro USB cable

The code for the project is shown below:

#include <uFire_EC.h>
#include <uFire_pH.h>
#include <WiFiNINA.h>
#include <ArduinoMqttClient.h>

#define SECRET_SSID "ENTER WIFI SSID HERE"
#define SECRET_PASS "ENTER WIFI PASSWORD HERE"

//calibration solutions used
#define PH_HIGH_SOLUTION_PH 7.0
#define PH_LOW_SOLUTION_PH  4.0
#define EC_HIGH_SOLUTION_EC 10.0
#define EC_LOW_SOLUTION_EC  1.0
#define CALIBRATION_TEMP    20.0

// topics for the mqtt sensors
// Make sure all stations have different topics
#define EC_TOPIC       "EC1"
#define PH_TOPIC       "PH1"
#define CALIB_TOPIC    "CALIB1"
#define MQTT_BROKER    "ENTER MQTT SERVER IP HERE"
#define MQTT_PORT      1883

int status = WL_IDLE_STATUS;     // the Wifi radio's status
String message;

uFire_pH ph;
uFire_EC ec;
WiFiClient wifiClient;
MqttClient mqttClient(wifiClient);

void check_connection()
{
  if (!mqttClient.connected()) {
    WiFi.end();
    status = WiFi.begin(SECRET_SSID, SECRET_PASS);
    delay(10000);
    if (!mqttClient.connect(MQTT_BROKER, MQTT_PORT)) {
      Serial.print("MQTT connection failed! Error code = ");
      Serial.println(mqttClient.connectError());
      delay(100);
    }
    mqttClient.subscribe(CALIB_TOPIC);
  }
}

void setup()
{
  Serial.begin(9600);
  while (!Serial);

  // connect to wifi and mqtt broker
  check_connection();
  
  // coorectly initialize the uFire sensors
  // note the Wire.begin() statement is critical
  Wire.begin();
  ec.begin();
  ph.begin();
}

void loop()
{
  // mqtt keep alive
  mqttClient.poll();

  // read messages 
  message = "";
  while (mqttClient.available()) {
      message += (char)mqttClient.read();    
    }

  // execute calibration if requested
  Serial.println(message);
  if (message == "EC1_HIGH") ec.calibrateProbeHigh(EC_HIGH_SOLUTION_EC, CALIBRATION_TEMP);
  if (message == "EC1_LOW")  ec.calibrateProbeLow(EC_LOW_SOLUTION_EC, CALIBRATION_TEMP);
  if (message == "PH1_HIGH") ph.calibrateProbeHigh(PH_HIGH_SOLUTION_PH);
  if (message == "PH1_LOW") ph.calibrateProbeLow(PH_LOW_SOLUTION_PH);

  // Measure EC 
  ec.measureEC();
  Serial.println((String) "mS/cm: " + ec.mS);

  // Measure pH
  ph.measurepH();  
  Serial.println((String) "pH: " + ph.pH);

  // Ensure the wifi and mqtt connections are alive
  check_connection();

  // post EC to MQTT server
  mqttClient.beginMessage(EC_TOPIC);
  mqttClient.print(ec.mS);
  mqttClient.endMessage();

  // post pH to MQTT server
  mqttClient.beginMessage(PH_TOPIC);
  mqttClient.print(ph.pH);
  mqttClient.endMessage();

  // ensure sensors are not probed too frequently
  delay(1000);

}

Once you get all the materials you should first assemble the components. Connect the pH and EC board together using the Qwiic-to-Qwiic connector, then use the Qwiic-to-male connector to hook up one of these boards to the Arduino (doesn’t matter which one). Connect the black cable to ground, red cable to 5V, blue cable to SDA, and yellow cable to SCL. Set up your board according to the instructions in the Arduino MKR wifi 1010 getting started page, modify the code above to properly include information about your wifi network, calibration solutions, and MQTT server, then upload the code. The Arduino will connect to your Wifi and MQTT servers and automatically reconnect when there are connection issues.

The above code will also post the readings of the pH and EC sensors to topics PH1 and EC1 respectively if you add an input in MyCodo to capture these readings you should be able to store them and take control actions using the MyCodo interface. Additionally, the Arduino code will respond to calibration requests published to the topic “CALIB1”. For example, if you want to calibrate your EC sensor with a two-point calibration method with a standard solution with an EC of 10mS/cm, you would put the electrode in the calibration solution, then send the message “EC1_HIGH” to the CALIB1 topic and the Arduino will perform the task as requested. The code assumes you will want to do 2 point calibrations for both EC and pH, with the calibration events triggered by EC1_HIGH, EC1_LOW, PH1_HIGH, and PH1_LOW. Note that the definition of the EC and pH values of the calibration solutions should be changed to the solutions you will be using within the code. The high/low values in the code, as is, are 10mS/cm|1mS/cm for EC and 7|4 for pH.


Calibrating a capacitive moisture/water content sensor for hydroponics

As I’ve mentioned multiple times in my blog, moisture sensing is one of the most important measurements in a hydroponic crop that uses a significant amount of media. It allows you to properly time irrigations and avoid over or under watering your plants. Capacitive sensors are the lowest cost initial approach to adequate moisture monitoring of your media. In this post, we are going to learn how to use an Arduino with a gravity shield and a low-cost capacitive moisture sensor in order to accurately monitor the water saturation of our media.

A capacitive sensor plugged into an LCD shield and an Arduino UNO. The measurements are very easy to track with this setup.

An analogue capacitive moisture sensor like this one does not expose any metallic parts to the media and can be used for the monitoring of moisture content. This sensor is powered by 3.5-5V and gives you a voltage signal that is proportional to the dielectric constant of the media it is in. As the dielectric constant of media changes with the presence of water, so does the signal of the sensor. However, no specific voltage corresponds to a specific water content measurement by definition, so we need to calibrate the sensor in order to interpret the voltage values we read from it. In order to get readings from this sensor, I use an Arduino UNO, the above-linked capacitive sensor, and an LCD shield from dfrobot that I can use to easily get the device readings. The arduino code used for this device is also shared below.

#include <U8glib.h>

#define XCOL_SET 0
#define XCOL_SET_UNITS 50

U8GLIB_NHD_C12864 u8g(13, 11, 10, 9, 8); 
float capacitance;

void draw() {

  u8g.setFont(u8g_font_helvB10); 
  
  u8g.drawStr(0,21,"M_SENSOR:");
  u8g.setPrintPos(XCOL_SET,51);
  u8g.print(capacitance);
  u8g.drawStr( XCOL_SET_UNITS,51,"mV" );
  
}

void setup() {
  pinMode(LED_BUILTIN, OUTPUT);
  pinMode(4, OUTPUT);
  Serial.begin(115200);
  analogReference(DEFAULT); 
  Serial.println("MOISTURE");

  u8g.setContrast(0);
  u8g.setRot180();
}

void loop() {

  draw();
  capacitance = analogRead(1);
  Serial.println(capacitance);

  u8g.firstPage();
    do  {
      draw();
    } 
      while( u8g.nextPage() );   

  delay(1000);
  
}

The calibration of a moisture sensor usually requires the creation of what soil scientists call a “water retention” curve, which is a curve where you plot the sensor’s signal as a function of a fixed volume or weight of water added to the media. However, this approach involves the use of many different containers and the addition of water to the media followed by oven drying steps in order to accurately determine how much moisture was actually in the media for every measurement carried out.

In order to do this procedure in an easier manner, losing as little accuracy as possible, I have created a calibration procedure that makes use of natural drying and only requires one single oven drying step. The procedure is as follows:

  1. Heat the media that will be used for an experiment in an oven at 110°C (this drives out all water).
  2. Wait for the media to cool to room temperature.
  3. Fill the container that will be used for the test (this can plastic but has to have holes at the bottom). Put the sensor in the media, make sure the sensor is driven into the media until the top line is reached.
  4. Take a reading, this is the “completely dry” media reading.
  5. Disconnect the sensor from the Arduino.
  6. Weigh the container+media+sensor. This will be the “dry weight”.
  7. Take the sensor out.
  8. Add water to the media until there is ample runoff coming out of the bottom.
  9. Wait until no more runoff comes off.
  10. Put the sensor in the media, making sure you drive it in until the top line is reached. The sensor won’t be taken out for the remainder of the experiment.
  11. Connect the sensor and take a reading. Take note of this value.
  12. Disconnect the sensor.
  13. Weigh the container+media+sensor. Take note of this value. The first reading you take is the “max saturation” weight.
  14. Repeat steps 11 to 13 every 1-6 hours (time is not very important as long as you gather enough data points) until you reach close to the dry weight. This can take several days depending on the media used. The more points you measure, the more accurate your curve will be.

After carrying out this procedure, you can create a curve like the one shown below. You can use the difference between each weight and the dry weight divided by the difference between the weight at max saturation and the dry weight in order to calculate the water saturation percentage. As you can see, the curves for these sensors are fairly linear in the 40-100% moisture range for the media I tested, while below 40% the regime changes and the measurement increases exponentially until it reached the “dry weight” sensor value. The entire curve can be described with a power-law equation. This behavior will not be the same for all media tested, reason why it’s very important for you to calibrate the sensor for the specific media you want to use.

Calibration curve for a capacitive moisture sensor. In this case, the media was a mixture of 50% river sand and 50% rice husks.

Once you have your sensor calibrated you can know what a measurement in mV implies in terms of water saturation for a given media type. This allows you to time your irrigations at a given water saturation % effectively. Which water saturation percentage might be better, depends on the properties of your media and how the water potential changes as a function of the water saturation. However, this allows you to experiment with irrigations at different water saturation % values and figure out exactly where you need to water so that your plants are not under or overwatered.

It is also worth noting that the above sensor is probably not rugged enough for use in a hydroponic setup without a bit more hardening. In order to use these sensors in practical applications, you should apply conformal coating to the electronics at the top of the sensor and then use shrink tubing in order to fully protect these electronics from the elements.


Pros and cons of building your own sensor and data logging system in hydroponics

If you’ve read my blog before, you know how important data logging is to having a successful hydroponic crop. Data allows you to monitor and tune the different variables in your grow, which allows you to give your plants the perfect environment through their entire growing cycle. However, deciding how to do this is not simple, you need to decide if you’re going to go with a company that sells some pre-made data-logging solution or you need to build everything yourself. In this post, I’m going to talk about several pros and cons of building your own data logging system for your hydroponic crop.

Pros

You have control over everything. The most important pro when building your own data logging solution is that you have total and absolute control over all aspects of it. If you want to support some type of sensors or have your data stored a certain way, there is nothing preventing you from doing this except your own skills and imagination. If you want to support an obscure messaging protocol, wireless transmission system, etc, it is all up to you. You won’t be limited by the management decisions of an external company and you will be able to build a system that perfectly caters to your needs.

Plant Monitoring System
A simple plant monitoring custom built system. Read more here.

You will be able to leverage low-cost hardware. When building your own system you will be able to get all the parts yourself. This means you will be able to substantially reduce costs. Of course, you’re incurring the important cost of your time but the hardware itself will be low cost and once you implement the basic setup you will be able to connect new rooms and build new logging stations for a fraction of the cost of buying one commercially.

Take advantage of new hardware quickly. As new technologies for monitoring environmental variables are invented or the desire to control new variables comes into play, your ability to fully control your setup will allow you to take advantage of new hardware that comes into the scene while companies will usually be very slow to respond to such changes.

A much deeper understanding. When you build all the monitoring setup yourself, you will create a lot of understanding about how the sensors work, how each one of them is calibrated, how data is transmitted, stored, etc. If you build your own monitoring setup you will gain a much deeper understanding than somebody who just buys an off-the-shelf product.

No need for patchwork approaches. When you decide to get a commercial solution for data logging, one of the issues that comes along is that you will get the setup from a company that supports some types of sensors but you will often face challenges if you want a sensor outside this offering. This will usually mean buying a setup that includes that sensor from a completely different company, measuring some variables with one system and some others with another system.

Cons

No one to support it. The biggest drawback of building things yourself – or hiring someone to build a custom system for you – is that you will have no one to help you debug your system when things go wrong. You will also have limited ability to delegate this work, as your highly custom system will demand somebody with a high level of skill to become familiar with it and operate it with the same level of proficiency as you do. A custom solution means all of this responsibility will fall on the shoulders of those who developed the system.

Nano 33 IoT + EC/pH/ORP + WebAPK
A custom built data logging system to read EC/pH/ORP. Read more here.

Limited by your knowledge. Although it is true that you will get a pretty deep understanding of the things you decide to incorporate into your system, you will also be very limited in the design and implementation of your system because of your particular limitations as an individual. A big company that develops a data logging system will have dozens of people working on it, and all of their experience will go into the decisions that were made in the sensor and software implementations. This can mean better sensor choices are made, more robust communication protocols are used, etc.

Not built for sharing. Custom-built systems usually have the problem that they are built with poor documentation. Sharing is normally not the priority and people will prefer to build “fast and dirty” in order to get things done. This means that the code is usually poorly commented and of a lower quality than what you get from a product that comes from a business. Although some people who build custom software that they intend to release as open-source implementations will often go to great lengths to provide great code quality this is rarely the case when the intention is not to make everything open source.

Big overhauls are a big problem. Since your custom building efforts will usually rely on one or two individuals, bad decisions that are made at the beginning of a project will carry a big toll during the entire life of the system. Poor decisions will be hard to overcome, as a lot of work will be needed to overhaul these “built from scratch” systemA big business with large teams will make fewer poor decision and those mistakes will be found out and fixed faster.

Messy hardware that often breaks easily. Due to the fact that people who build DIY implementations will go for rapid prototyping and functionality over robustness, sensor and data logging setups built in this manner will usually lack the roughness of commercial implementations. While a business dedicated to data logging wants to build systems with adequate sensor housing, and durability for transport, with customer satisfaction in mind, a person who builds this for him or herself might be ok with having a lot of exposed boards and cables. Overall DIY setups are therefore less robust, more likely to break, and more likely to suffer from electrical issues like poorly grounded circuitry.

Hopefully, the above pros and cons give you a useful idea of what you’re gaining and losing when you decide to build your own custom-built data logging system for hydroponics. While you will usually get much more flexible, lower cost, cohesive and personalized setups from custom building, this will usually come at the cost of higher support costs in time, lower reliability, lower build quality, and compromises in quality depending on where your strengths as a builder/coder are. For small setups, it is usually a no-brainer to go with a custom setup – because of how much you learn from doing this and how much you can experiment – while for larger setups careful consideration of the above cons is important.


Hardware for building a wifi-connected DIY monitoring/control system for a hydroponic crop

Success in hydroponic systems can be increased by having adequate control over a wide array of different variables. Having automated monitoring and control will mean faster reaction times and provide better information about crop cycles as they happen. Having the possibility to choose the sensors that you require and code the control algorithms yourself will also provide much more flexibility when compared with commercial solutions, although the price can often be higher since you are going to get hardware that has capabilities that will likely exceed the minimal capabilities required to perform the specific setup you will arrive at. In today’s post I want to talk about the hardware I generally use to build a basic DIY monitoring/control system that involves no soldering and allows for easy connections of all sensors. I will talk about each piece, its cost and why/how it’s needed within a basic system.

Raspberry Pi 4 – 39.61 USD. This is going to be the computer that will be the brain of the entire operation. The Raspberry Pi will receive information from all the sensors around and will make control decisions that will then be sent to the appropriate control-executing stations within the network, it will also record sensor readings and provide a proper interface for the management staff. Usually I use the raspberry Pi to host the database that contains all the sensor readings, plus the execution of the control algorithms and the hosting of web server that the people who manage the crop can access from their other devices (in order not to have to access the raspberry pi directly all the time).

The raspberry Pi 4 computer. Note that you will need a power supply cable and SD card as well, which are an additional cost to the above.

Arduino UNO WiFi REV2 – 39.96 USD. These arduino boards are going to be the heart of the sensing stations and the stations that execute control actions. They will take sensor readings and send them back to the Raspberry Pi via the wifi network. When I build DIY solutions of this type I usually use the MQTT protocol to communicate between the Raspberry Pi and the Arduinos, for this reason it’s really convenient to have the Arduinos include Wifi themselves, so that additional money does not need to be spent on WiFi chips for them. With the Arduino UNO WiFi REV2 you will have all the WiFi connectivity you need available from the get-go, with the ability to still use all the shields an Arduino UNO can support.

Whitebox labs Tentacle shield – 127 USD. This arduino shield offers you the ability to implement measurement of several different sensors in your hydroponic crop. With this shield you can connect up to 4 different Atlas probe sensors, with all the measurements being properly electrically isolated, allowing you to place all the different probes in the same tank.

Atlas pH kit – 164 USD. This is the pH probe sensor and EZO board that are required to be able to connect an Atlas pH probe to your Whitebox labs Tentacle shield above. This pH probe is of very good quality and will provide good readings even if the probe is immersed for a significant period of time. I have used these probes successfully for constant monitoring of recirculating solution tanks, with the probes having to be recalibrated every few months and so far no probes having to be replaced. However, if you want a probe that will withstand a lot of additional stress, then the industrial Atlas pH probe might be a better choice. The kit also includes the calibration solutions necessary to setup the probes.

Atlas EC probe conductivity kit – 239 USD. This contains the necessary materials to connect an EC probe to the Whitebox Tentacle shield. The kit also includes all the necessary calibration solutions to setup the probe, it is analogous to the pH kit mentioned above.

Gravity IO Expansion shield for Arduino – 8.90 USD. This shield provides you with a lot of additional plug-and-play IO capabilities for your Arduino UNO sensor/control stations. I generally use these shields to be able to easily connect digital/analogue sensors and relays from dfrobot. It is very easy to do and does not require the use of any soldering or proto-boards. When you couple the use of these shields with project boxes you can come up with some very robust and practical DIY implementations that are easy for anyone to create.

Gravity: IO Expansion Shield for Arduino V7.1
The Gravity IO shields are an incredibly versatile tool to connect sensors/relays to an Arduino sensing/control station

Gravity quad motor shield for Arduino – 14.90 USD. Like the above, I generally use these shields as part of control stations where I will be using motors to carry out control actions. This shield can power up to 4 small DC motors, so it is ideal to control small peristaltic pumps like the ones we generally use to move small amounts of concentrated nutrient solutions or pH up/down solutions.

Environmental sensors (Temperature, relative humidity, barometric pressure) BME280 – 15 USD. These sensors are my all-time favorites for measuring temperature, humidity and barometric pressure in hydroponic crops. They have one of the most accurate low-cost chipsets to measure humidity and this DFRobot package is extremely easy to plug into the DFRobot IO shield mentioned above (just plug the connector into a digital input row!).

Analog infrared carbon dioxide sensor – 58 USD. These sensors have been my go-to solution when it comes to measuring carbon dioxide concentrations. They are fairly accurate and can tell you if you are circulating air enough or if your carbon dioxide enrichment is working as expected. I usually equip at least one of the environmental sensing stations I setup with one of these sensors so that I can keep an eye on the crop’s average carbon dioxide level.

Capacitive soil moisture sensor – 14.90 USD. When we measure water content in hydroponic crops we are going to be placing the sensor in contact with highly corrosive and conductive nutrient solutions, so we want to avoid any water content measuring devices that use conductivity. This capacitive sensor has become my choice of sensor for the measuring of water-content, it is really easy to use and calibrate and offers the ability to monitor several different plants due to its relatively low cost.

Ambient light sensor – 2.60 USD. This very low cost sensors are great for telling whether lights are actually on/off based on their inputs. They can also give you a crude measurement of how strong light is – if you are growing under the sun – so they can help you track if shades are needed. There are certainly more elaborate sensor, but this sensor gets the job done for a very low price.

120V, 5A Relay – 2.60 USD. These relays are my go-to choice when having to power low power appliances on-off in a hydroponic setup. They are great to control things like fans and smaller lights. If you want to control larger lamps then I would suggest you use the 16A relays that can handle much larger currents. As with the previous sensors/controls we’ve discussed, these relays can be easily plugged into the Gravity IO shield, allowing for the easy building of relay control stations.

The above are some of the pieces that I will commonly use in a hydroponic crop for systematic monitoring/control. While some of these – like the pH/EC sensors and boards – could be replaced by cheaper equivalents, I prefer to go with more expensive parts that have better electrical isolation and properties. However, a very cool and useful sensor setup can be built with just an Arduino, a Raspberry Pi, a gravity IO shield and a bunch of environmental sensors. Of course the above setup gives the most flexibility but significantly lower cost alternatives are possible if very specific stations want to be built or if the use of very specific sensor configurations is desired (so no gravity shields would be used and the sensors would just be soldered where needed).


Building a DIY control infrastructure for a hydroponic crop: Part one

Controlling an entire hydroponic crop using electronics is not a trivial task. This includes everything from the automated control of things like relative humidity and ambient temperature, to other variables, such as lights, solution pH, conductivity and temperature. Many paid solutions exist in the market, but, in my experience, none of them offer enough flexibility to accommodate all potential environments, as all the ones I know are closed source and do not allow users to readily modify the firmware/software used to fit the user’s particular needs. Through the past 5 years I have setup control infrastructures across several different crops and have usually done so using an entirely DIY infrastructure that focuses on flexibility and power for the end user. In this post I want to talk about how this setup usually works and why I came to these design choices.

Usual network configuration I used to built electronic monitoring/control infrastructures for hydroponics

In general the infrastructure I setup relies on the use of wifi for the communication of the devices. This is because it’s usually the easiest to setup, although it might not be the most power efficient or the most desirable in all cases. I generally divide devices into three camps. There is a main device – which is usually a capable computer – which serves as the “central hub” for the entire setup. This computer contains the main database that stores all information about devices, sensor readings, calibration variables, alarms, etc and is in charge of deciding which control actions to take given the sensor reading it is receiving and the control devices it has access to. This central computer usually hosts a website as well, where the user can easily modify things, issue manual control actions, add new devices, set up alarms, etc. The computer can be duplicated as well, to prevent this from being an important point of failure. In several cases we have used a raspberry pi to play this role.

The second and third group of devices are usually Arduinos whose main role is to either take readings (measuring stations) or execute control actions (control stations). Some arduinos might actually serve both purposes as an arduino can often be fit with things like pH/EC probe readings as well as relays that control peristaltic pumps that are used to push pH up/down or nutrient solution into a solution tank. It is worth noting that the decision of what to do for control is never taken by any control station but all they do is interpret control messages from the computer and then try to execute those actions and then give back some response of what’s going on. Measuring stations, on the other hand, are only trusted with the task of taking some measurement from the environment and broadcasting it to the network, the only thing they might listen for are messages issued by the computer to modify their calibration, whenever this is required.

The arduino nano includes wifi capabilities and offers a very convenient low-power core for measuring stations that do not require high power to operate sensors

Measuring stations can be fully customized to have as many reading as the user desires and can be implemented to do all sorts of things, from measuring temperature and humidity, to measuring air-flow, to measuring media water content. This allows for dozens of different temperature and humidity reading spots using different kinds of sensors, to monitoring things such as irrigation flow and solution ORP and dissolved oxygen values.

The entire setup relies on the use of the mosquitto (mqtt) protocol in order to have each device brodcast a specific topic with a specific reading that other devices can subscribe to. The computer will listen to all the devices it sees within its database and it is therefore easy for a new device to be added by a user, since it only requires the inclusion of the device into the database. The measure/control stations can subscribe to the specific topics their interested in for calibration or control actions and can act whenever they receive these messages. All the devices are automatically added to a web platform and alarms can easily be set for any of the measurements carried out by the measuring stations.

A big advantage of this approach is that control actions can be made as complex as the user desires. This includes doing things like implementing reinforcement learning based controls for things like temperature/humidity allowing the computer to use a wide array of measurements in order to take control actions, not relying solely on the measurement of one limited sensor to make these decisions. This allows a computer to use information such as outside temperature to decide how much air it wants to get into the facility for control, or how long it wants to turn on humidifiers in order to allow the desired level of humidity within a grow room.

With all this said, DIY control is definitely not the easiest route to take. Implementing something like the above will require the purchasing of a lot of different electronics – which are sometimes expensive depending on what the user wants – and does require a lot of time programming firmware and deploying software so that the desired outcome can be achieved. With that said, the unparalleled level of control is often worth it and can be accompanied by substantial gains in the information available to the user, which often leads to improvements in yields and the significantly quicker catching of potentially important problems.

On the next part of this post, I will talk about some of the practical aspects of this project, such as which arduinos and sensors I usually use and how these are setup to communicate with the central computer. If you want to learn more about how I can help you set this up for your crop please feel free to contact me using the website’s contact form.


The best cheap sensor setup for relative humidity in hydroponic automation projects

I have written in the past about humidity in hydroponics, especially how accurately measuring humidity is hard due to problems with the sensors. In my experience during the past 5 years with different humidity sensors in Arduino based automation projects I have tried different chipsets and have now reached a conclusion about my preferred chipset setup for the measurement of humidity in hydroponics. Today I want to share with you my experience with different sensors, what I think the best overall setup is and where you can buy breakout boards that use these chipsets to use them in your projects.

One of my favorite sensors for the measurement of relative humidity in hydroponics

The first sensors I ever tried for measuring humidity in hydroponics where the DHT11 sensors which are the cheapest but have really poor accuracyand limited range. I then moved to the DHT22 sensors (also known as AM2302 sensors) which in theory have an accuracy of +/-3% but I had a lot of problems with the sensors dying on me as a function time, this was particularly the case when the sensors were places near plant canopy, where they could be exposed to much higher levels of humidity than those placed to measure overall room humidity values. We also tried using them in a commercial tomato greenhouse and the sensors placed near canopy failed miserably after only a couple of months. More infuriatingly, the sensors that did not outright die seem to have lost a lot of their sensibility, with increased hysteresis in their measurements as humidity changed through the days.

This table of properties was taken from this website.

I then moved to the SHT1x humidity sensors – which were much better and more reliable – and these sensors became my go-to sensors for around a year. However I was increasingly concerned about problems with systematic errors, since all these sensors use a capacitive technique to measure relative humidity, so I decided to try other sensors that used different measuring methods. The only cheap sensor I could find using an alternative measuring technique was the BME280 – released within the last two years – which turned out to be a very reliable sensor. My default setup for measuring humidity has now become a 2 sensor setup where I connect one SHT1x and one BME280 sensor board to an Arduino and then make sure both sensors are within 2% to take a value or issue a control action. If the deviation between both sensors is above 2% then I make sure to be notified about it so that I can see if there is any problem with either of them. I was happy to learn that my conclusions are also supported by other people who have systematically evaluated humidity sensors.

Although I usually prefer the sensors from dfrobot for regular builds, as they are easier to use, you can find breakout boards or more elaborately packaged sensors with these chipsets at other places. In particular I have found the mesh protected SHT-10 sensor from Adafruit to be particularly useful for more demanding environments (like canopy, greenhouses or just outdoor sensing) which might be suitable for those of you looking for a significantly more robust solution to measure humidity, even if at a higher price. Adafruit also carries low cost breakout boards for the BME280 and the SHT-31D, which is a more accurate chip of the SHT family. In any case, I wouldn’t bother with the AM family of sensors, as they have proven to be less reliable than the above mentioned counterparts.

Last but not least, please make sure to contact me if you’re interested in getting my help or input to build a custom made sensing setup for your hydroponic facilities. Having wireless sensing and controls, all integrated into a centralized sensing unit, is perhaps one of the best ways to get reliable real-time data and enhance the control and decision making processes within your hydroponic facility.


Creating a robust pH/EC monitor for hydroponics using Atlas probes and an Arduino

A few months ago I talked about how you could build a simple sensor station for your hydroponic projects using an arduino (see here). However this small project used the relatively cheap – but I have found not very robust – pH/EC probes and boards from gravity which makes it a poorer choice for a more professional project aiming to constantly monitor the pH/EC of a production hydroponic setup. Today I am going to tell you how you can build a dedicated pH/EC monitor using the robust pH probes from Atlas, which also have several important advantages we will be discussing within this post. I would also like to point out that Atlas is not paying me anything to write this post, I write just because of my experience using their probes.

The pH/EC probes from gravity have several problems when looking for a robust sensing setup. The first issue they have is that the probes are not rated for constant immersion, so they are damaged if you place them within solution the whole time which is probably what you want to do within a production hydroponic setup. The second issue is that the boards require cable connections to the Arduino which introduces a significant amount of noise that can causes problems with measurements. Due to poor isolation there can also be issues with the gravity boards when measuring EC/pH at the same time. To overcome these issues we can use probes and boards from atlas which have the advantage of having no cable connections to the Arduino – connections are through pins directly – plus the probes are rated for constant immersion and are much more robust. These are the things we would need to build this project:

As you notice this sensor project is much more expensive than the sensor station I had discussed before, with a price tag of around 490 USD (not including shipping). However when looking for a robust setup you definitely should favor the additional expense as this will likely be paid off with much longer service times.

When you get the pH/EC kits the first thing you want to do is change your EZO boards (the small circuit boards that come with them) to i2C mode so that you can use them with your mini tentacle shield. To do this follow the instructions here, follow the instructions in the “Manually switch between UART and I2C” section, use female jumpers to make this process easier. Note that you can use your LCD shield analogue 5V and ground pins when you need power within the process.

//Libraries
#include <U8glib.h>
#include <stdio.h>
#include <Wire.h>
#include <Arduino.h>

#define TOTAL_CIRCUITS 2  

///---- variables for pH/EC tentacle shield ------- //

#define TOTAL_CIRCUITS 2   

char sensordata[30];                  
byte sensor_bytes_received = 0;       

byte code = 0;                        
byte in_char = 0;  
int channel_ids[] = {99, 100} ;                   
   
// ------------------------------------------------ //    

// EC values // CHANGE THESE PARAMETERS FOR EC PROBE CALIBRATION
#define EC_PARAM_A 0.00754256

//pH values // CHANGE THESE PARAMETERS FOR PH PROBE CALIBRATION
#define PH_PARAM_A 1.0
#define PH_PARAM_B 0.0

#define XCOL_SET 55
#define XCOL_SET2 65
#define XCOL_SET_UNITS 85

//--------------------------

U8GLIB_NHD_C12864 u8g(13, 11, 10, 9, 8);   
float pH, EC;

//--------------------------

void draw() {
  u8g.setFont(u8g_font_04b_03); 
  
  u8g.drawStr(0,11,"pH:");
  u8g.setPrintPos(XCOL_SET,11);
  u8g.print(pH);
  
  u8g.drawStr(0,21,"EC:");
  u8g.setPrintPos(XCOL_SET,21);
  u8g.print(EC);
  u8g.drawStr( XCOL_SET_UNITS,21,"mS/cm" );
  
}

void read_tentacle_shield(){

  for (int channel = 0; channel < TOTAL_CIRCUITS; channel++) {      
  
    Wire.beginTransmission(channel_ids[channel]);     
    Wire.write('r');                         
    Wire.endTransmission();                       
    
    delay(1000); 

    sensor_bytes_received = 0;                        
    memset(sensordata, 0, sizeof(sensordata));        

    Wire.requestFrom(channel_ids[channel], 48, 1);    
    code = Wire.read();

    while (Wire.available()) {         
      in_char = Wire.read();           

      if (in_char == 0) {               
        Wire.endTransmission();         
        break;                          
      }
      else {
        sensordata[sensor_bytes_received] = in_char;      
        sensor_bytes_received++;
      }
    }
    
    if (code == 1){
      if (channel == 0){
        pH = atof(sensordata);
        pH = pH*PH_PARAM_A + PH_PARAM_B;
      }
      if (channel == 1){
        EC = atof(sensordata);
        EC = EC*EC_PARAM_A;
      }    
    }
  }
  
}

void setup()
{
    pinMode(13,OUTPUT);  
    Serial.begin(9600);
    u8g.setContrast(0);
    u8g.setRot180(); 
}

void loop()
{
 
  digitalWrite(13, HIGH);       
  delay(800);
  digitalWrite(13, LOW);   
    
  read_tentacle_shield();

  u8g.firstPage();
    do  {
      draw();
    } 
      while( u8g.nextPage() );          
      
}

Once you have changed the EZO boards to i2C you can now plug everything into the arduino and upload the code into your arduino. Plug the EZO boards into the mini tentacle shield and then plug that shield into the arduino. You’ll notice that the EZO boards make it impossible to plug the LCD screen directly on top – as the EZO circuits make the shield too tall – so you should use stackable headers to extend the connections so that you can plug the LCD screen on top without any problems. Make sure you download and install the U8glib library in your arduino IDE before uploading the code.

As with the previous code you’ll notice there are variables called PH_PARAM_A, PH_PARAM_B and EC_PARAM_A within the beginning of the code that you should change in order to calibrate your probes. Follow the instructions about calibration I gave in the previous post in order to figure this out. Using the calibration solutions that come with your kits you’ll be able to perform this calibration procedure. Whenever you want to calibrate your probes you should reset these variables to their original values, reupload the code and retake measurements.

Following this guide you will have a very robust sensor setup using very high quality probes. These probes are also coupled with a board that has no wire connections with the arduino, offering very high quality readings with very small amounts of noise. Additionally the LCD shield opens up the possibility to add more sensors to your station so that you can monitor, temperature, humidity, and carbon dioxide potentially from a single place.