Ascorbic Acid as a Biostimulant: Alleviating Stress to Improve Yield and Quality in Hydroponic Systems
The search for sustainable biostimulants to enhance crop productivity has led researchers to investigate ascorbic acid (vitamin C) as a promising alternative to synthetic growth regulators. This natural antioxidant compound has shown remarkable potential in improving both yield and quality parameters in hydroponic and soilless cultivation systems.
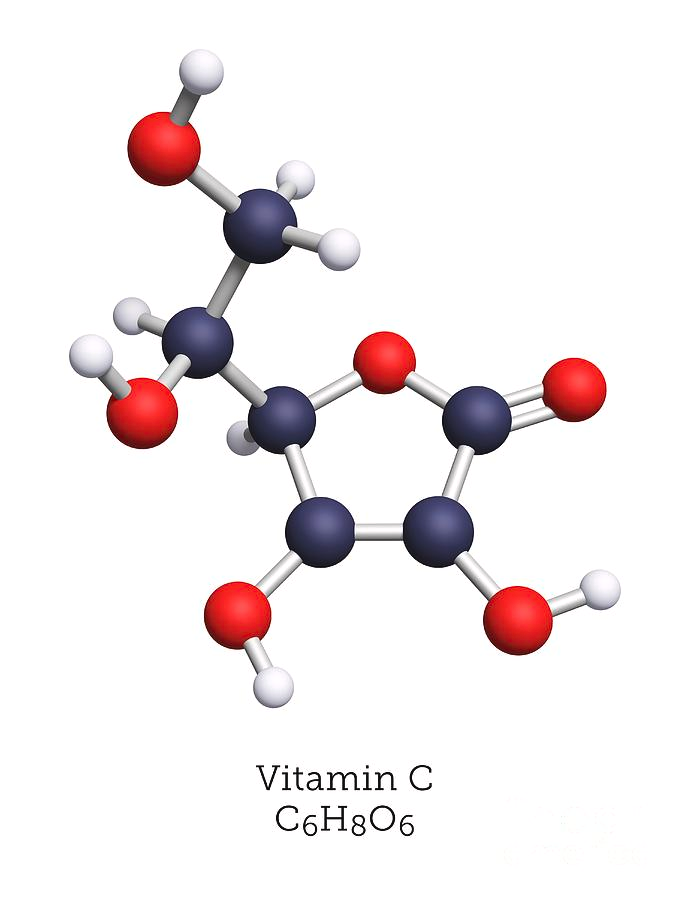
Model representation of Ascorbic Acid (Vitamin C)
Understanding Ascorbic Acid as a Biostimulant
Ascorbic acid functions as a (1) multifunctional non-enzymatic antioxidant that plays crucial roles in plant physiology beyond its traditional vitamin C function. In hydroponic systems, ascorbic acid applications can modulate several key physiological processes including photosynthesis, antioxidant defense mechanisms, and stress tolerance responses (2).
Recent research has demonstrated that exogenous ascorbic acid applications can significantly improve nutrient use efficiency and enhance plant growth under stress conditions. The compound acts as a signal molecule that (3) activates antioxidant defense systems and helps maintain cellular redox homeostasis during periods of environmental stress.
Application Methods and Optimal Concentrations
Foliar Applications
Foliar spraying represents the most widely studied application method for ascorbic acid in hydroponic crops. Research on lettuce cultivation has shown that (4) foliar applications of 100-400 ppm ascorbic acid can significantly improve growth parameters and yield under saline conditions. The optimal concentration appears to be crop-specific, with 400 ppm showing the most pronounced effects on lettuce fresh weight and antioxidant enzyme activity.
Root Zone Applications
Direct addition to hydroponic nutrient solutions has shown promising results at lower concentrations. Studies indicate that 200 ppm ascorbic acid applied through the nutrient solution can enhance Rhizobium activity in leguminous crops, leading to improved nitrogen fixation and protein synthesis (5).
Application Timing and Frequency
Foliar Applications: Apply during early morning or late afternoon to minimize photodegradation. Frequency of 7-14 day intervals has shown optimal results.
Nutrient Solution: Continuous low-level supplementation (50-100 ppm) or periodic higher doses (200-300 ppm) every 10-14 days.
Quantitative Effects on Yield Parameters
Multiple studies have documented significant yield improvements with ascorbic acid applications across different crops (note that these studies the yield improvements are over crops under stress conditions). In pea production, (6) treatments with 10 mM (approximately 176 ppm) ascorbic acid increased pea pod yields 40%.
The primary mechanism behind quality improvements involves the strengthening of plant antioxidant systems. (6) Ascorbic acid treatments significantly increased superoxide dismutase, peroxidase, and catalase activities, leading to improved stress tolerance and better maintenance of cellular integrity during growth and post-harvest storage.
Stress Tolerance and Environmental Benefits
One of the most significant advantages of ascorbic acid applications in hydroponic systems is enhanced stress tolerance. (2) Research has demonstrated that ascorbic acid pretreatment can help plants better cope with various abiotic stresses including salinity, drought, and temperature extremes.
In saline conditions, which are particularly relevant for hydroponic systems using recycled water or high-EC nutrient solutions, ascorbic acid applications at 200-400 ppm have shown (4) significant protective effects. Treated plants maintained higher growth rates and better physiological function compared to untreated controls under stress conditions.
Stress Tolerance Benefits:
Improved salinity tolerance in nutrient film technique systems
Enhanced temperature stress resistance in greenhouse environments
Better adaptation to fluctuating nutrient concentrations
Reduced oxidative damage during transport and storage
Integration with Hydroponic Management Practices
Compatibility with Nutrient Solutions
Ascorbic acid demonstrates good compatibility with standard hydroponic nutrient formulations. However, care should be taken regarding solution pH, as ascorbic acid stability decreases significantly at pH levels above 7.0. Most hydroponic systems operating at pH 5.5-6.5 provide optimal conditions for ascorbic acid stability and effectiveness (3).
When integrating ascorbic acid into nutrient management protocols, consider the following stability factors. Light exposure can rapidly degrade ascorbic acid, making it essential to prepare fresh solutions or use opaque reservoirs. Temperature also affects stability, with cooler reservoir temperatures (15-20°C) helping maintain compound integrity longer than warmer conditions.
Economic Considerations
The cost-effectiveness of ascorbic acid applications compares favorably to synthetic growth regulators and specialized biostimulant products. (5) Economic analysis of pea production showed that the 16-40% yield increases achieved with 200 ppm applications provided substantial return on investment, especially when considering the additional quality premiums for enhanced nutritional content. Again, note that this is to alleviate stressful conditions.
Application Rate
Cost per 1000L
Expected ROI
Best Use Case
100 ppm
$2-4
200-300%
Preventive stress management
200 ppm
$4-8
300-400%
Optimal yield enhancement
400 ppm
$8-16
250-350%
Stress recovery and quality improvement
Practical Implementation Summary
Ascorbic acid represents a scientifically validated, economically viable biostimulant option for hydroponic growers seeking to enhance both yield and quality when stressful conditions are present. The optimal application strategy involves foliar sprays at 200-400 ppm concentrations, applied every 7-14 days during active growth periods. For continuous systems, nutrient solution supplementation at 50-100 ppm provides baseline benefits with periodic increases to 200-300 ppm during stress periods. The documented improvements in antioxidant content, stress tolerance, and overall plant health make ascorbic acid a valuable addition to sustainable hydroponic production protocols.
If you use ascorbic acid in root applications make sure to control biofilm formation and properly clean your irrigation lines. Test foliar applications first, root applications carry important risks of biofilm formation inside lines. Clogging can happen if application rates and times are not properly controlled or if irrigation lines are not properly maintained.
An Expanded View on Root Zone Temperature in Soilless and Hydroponic Systems
When we think about optimizing hydroponic systems, most growers focus on nutrient concentrations, pH levels, and lighting conditions. However, one of the most critical yet often overlooked factors that can dramatically impact plant performance is root zone temperature. Understanding the intricate relationship between temperature and root physiology can be the difference between a mediocre harvest and exceptional yields.
Root zone temperature (RZT) represents the thermal environment surrounding plant roots and serves as a fundamental driver of physiological processes in soilless cultivation systems. Unlike soil based agriculture where thermal mass provides natural temperature buffering, hydroponic and soilless systems expose roots to more dramatic temperature fluctuations, making active temperature management both more challenging and more important (1).
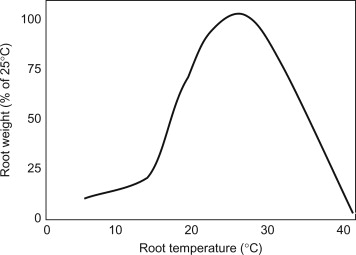
Relative root zone mass as a function of mass at the optimal temperature, taken from (9). Note that this is for a soil system, for soilless media system the response curves are similar while for DWC the curves are more shifted to the left because of oxygen solubility issues.
Optimal Root Zone Temperatures for Different Systems
The optimal root zone temperature varies significantly between deep water culture (DWC) and other soilless systems, primarily due to differences in oxygen availability and heat dissipation characteristics. Research has consistently demonstrated that temperature requirements differ based on the cultivation method employed.
Deep Water Culture Systems
In DWC systems, where roots are directly immersed in oxygenated nutrient solutions, optimal temperatures typically range from 18 to 22°C (64 to 72°F). This relatively narrow range reflects the critical balance between metabolic activity and dissolved oxygen availability (2). The inverse relationship between water temperature and oxygen solubility becomes particularly important in DWC, as warmer temperatures can quickly lead to hypoxic conditions that stress plant roots and promote pathogenic organisms.
Experienced DWC practitioners often target the lower end of this range, around 20°C (68°F), to maximize dissolved oxygen content while maintaining adequate metabolic rates (3). Temperatures above 25°C (77°F) in DWC systems frequently result in root browning, reduced nutrient uptake, and increased susceptibility to root rot pathogens.
Soilless Media Systems
Soilless systems utilizing growing media such as rockwool, perlite, or coco coir can tolerate slightly higher root zone temperatures due to improved aeration and thermal buffering properties of the growing medium. Optimal temperatures for these systems typically range from 20 to 28°C (68 to 82°F), with many commercial operations targeting 22 to 25°C (72 to 77°F) for optimal performance (1).
The growing medium provides several advantages over liquid culture systems. The air spaces within the substrate maintain higher oxygen levels even at elevated temperatures, while the thermal mass of the medium helps dampen rapid temperature fluctuations. This thermal stability allows for more forgiving temperature management while still maintaining excellent plant performance.
System Type
Optimal Temperature Range
Critical Considerations
Common Challenges
Deep Water Culture
18-22°C (64-72°F)
Dissolved oxygen levels
Limited thermal mass, rapid temperature changes
Rockwool Systems
20-26°C (68-79°F)
Media moisture retention
Uneven heating, thermal bridging
Coco Coir/Perlite
22-28°C (72-82°F)
Media thermal properties
Variable thermal conductivity
Nutrient Film Technique
18-24°C (64-75°F)
Flow rate and film thickness
Channel heating, pump heat
Impact on Hydraulic Transport and Water Relations
Root zone temperature profoundly influences hydraulic transport mechanisms within plants, affecting both water uptake rates and the efficiency of nutrient transport to aerial parts. The relationship between temperature and hydraulic conductivity follows predictable patterns that directly impact plant performance.
Water Uptake Mechanisms
Temperature affects water uptake through multiple pathways, including both passive and active transport mechanisms. Research on strawberry plants has shown that water absorption rates initially increase with rising root zone temperatures but subsequently decrease when temperatures exceed optimal ranges (4). This biphasic response reflects the competing effects of increased membrane fluidity and enzyme activity at moderate temperatures versus protein denaturation and membrane dysfunction at excessive temperatures.
Root pressure and hydraulic conductivity show particularly strong temperature dependence. Low root zone temperatures severely reduce both parameters, limiting the plant’s ability to transport water and dissolved nutrients from roots to shoots (4). This effect becomes especially pronounced when root zones are maintained below 15°C (59°F), where hydraulic transport can be reduced by more than 50% compared to optimal temperatures.
Xylem Development and Function
Temperature also influences the development of xylem tissue, which serves as the primary pathway for water and nutrient transport. Studies have demonstrated that optimal root zone temperatures promote proper xylem differentiation and vessel development, enhancing long term transport capacity (5). Conversely, suboptimal temperatures can result in poorly developed vascular tissue with reduced transport efficiency.
Effects on Plant Growth and Development
The influence of root zone temperature on plant growth extends far beyond simple metabolic rate changes, affecting fundamental aspects of plant development including root architecture, shoot growth patterns, and reproductive development.
Root Development and Architecture
Root zone temperature significantly impacts root morphology and development patterns. Research with lettuce plants has shown that optimal temperatures (around 25°C/77°F) maximize both root and shoot dry weight accumulation, while temperatures of 15°C (59°F) or 35°C (95°F) result in reduced growth rates (2). The relationship between temperature and root development follows a classical optimum curve, with growth rates increasing linearly from minimum temperatures to an optimum, followed by sharp declines at supra optimal temperatures.
Interestingly, recent studies have revealed that raising root zone temperature just 3°C (5.4°F) above air temperature can result in significant improvements in plant productivity. This approach increased shoot dry weight by 14 to 31% and root dry weight by 19 to 30% across different air temperature conditions (1). These findings suggest that the optimal root zone temperature is not an absolute value but rather depends on the thermal environment of the aerial plant parts.
Shoot Growth and Biomass Accumulation
While root zone temperature directly affects root metabolism, its influence on shoot growth occurs through complex interactions involving nutrient uptake, hormone production, and resource allocation. Plants grown with optimal root zone temperatures show enhanced shoot growth rates, increased leaf area development, and improved overall biomass accumulation (6).
The mechanism underlying these growth improvements involves enhanced nutrient uptake and translocation from roots to shoots. When root zone temperatures are optimal, plants can more efficiently absorb and transport essential nutrients, leading to improved photosynthetic capacity and biomass production in aerial tissues.
Nutrient Uptake and Mineral Nutrition
Perhaps no aspect of plant physiology is more directly affected by root zone temperature than nutrient uptake. The temperature dependence of nutrient absorption reflects the fundamental biochemical nature of transport processes occurring in root tissues.
Macronutrient Absorption
The uptake of major nutrients including nitrogen, phosphorus, and potassium shows strong temperature dependence across all hydroponic systems. Classic research on tomato plants demonstrated that nutrient uptake for most elements peaks at approximately 26.7°C (80°F), with significant reductions in absorption rates at both higher and lower temperatures (7). This temperature optimum closely corresponds to the temperature range that maximizes plant growth and development.
Nitrogen uptake shows particularly interesting temperature responses, with both nitrate and ammonium absorption affected by root zone thermal conditions. At low temperatures, nitrate accumulation in roots increases while transport to shoots decreases, suggesting that cold stress impairs the translocation mechanisms responsible for moving absorbed nutrients to metabolically active tissues (8).
Pathogen Development and Root Health
Root zone temperature plays a crucial role in determining the microbial ecology of hydroponic systems, influencing both pathogenic and beneficial microorganisms. Understanding these temperature relationships is essential for maintaining healthy root systems and preventing disease outbreaks.
Pathogenic Microorganisms
Many of the most serious root pathogens in hydroponic systems show strong temperature preferences that overlap with optimal plant growth ranges. Pythium aphanidermatum, one of the most devastating hydroponic pathogens, causes severe root rot symptoms when root zone temperatures reach 23 to 27°C (73 to 81°F). This temperature range unfortunately coincides with optimal growing conditions for many crop plants, creating a challenging management situation.
The development of severe root browning and rot in greenhouse hydroponic crops often coincides with hot weather when nutrient solution temperatures rise above optimal ranges. Higher temperatures not only favor pathogen metabolism and reproduction but also stress plant roots, making them more susceptible to infection.
Oxygen Availability and Pathogen Suppression
The relationship between temperature and dissolved oxygen creates additional challenges for pathogen management. As temperatures increase, oxygen solubility decreases, creating anaerobic conditions that favor certain pathogenic organisms while simultaneously stressing plant roots. This dual effect explains why temperature management is so critical in hydroponic systems, particularly those with limited aeration capacity.
Maintaining root zone temperatures in the lower portion of the optimal range (18 to 22°C/64 to 72°F) helps maximize dissolved oxygen levels while providing adequate metabolic activity for plant growth. This approach represents a compromise that optimizes the balance between plant performance and disease suppression.
Beneficial Microorganisms
While pathogenic organisms often receive the most attention, root zone temperature also affects beneficial microorganisms that can enhance plant growth and disease resistance. Many beneficial bacteria and fungi have temperature optima that align with ideal plant growing conditions, suggesting co evolutionary relationships that can be exploited in hydroponic systems.
The use of beneficial microorganisms as biological control agents requires careful temperature management to maintain viable populations while preventing pathogen development. This balance represents one of the most sophisticated aspects of modern hydroponic management.
Metabolic and Biochemical Responses
Root zone temperature influences numerous metabolic pathways within plants, affecting everything from primary metabolism to secondary metabolite production. These biochemical responses help explain the growth and quality improvements observed with optimal temperature management.
Primary Metabolism
Optimal root zone temperatures enhance protein synthesis and amino acid metabolism in root tissues. Research has shown that raising root zone temperature by just 3°C (5.4°F) above air temperature significantly increases total soluble protein concentrations in both roots and leaves (1). This enhanced protein synthesis reflects improved metabolic activity and contributes to better plant growth and development.
The production of specific amino acids also responds to temperature management. Ten different amino acids, including alanine, arginine, aspartate, and others, show increased concentrations in root tissue when temperatures are maintained in optimal ranges (1). These amino acids serve as building blocks for proteins and as precursors for numerous other metabolic compounds.
Secondary Metabolite Production
Root zone temperature also affects the production of secondary metabolites that contribute to plant quality and nutritional value. Optimal temperatures increase the concentrations of important compounds including carotenoids, chlorophyll, and ascorbic acid (1). These improvements in secondary metabolite production enhance both the visual quality and nutritional value of harvested crops.
Interestingly, stress temperatures can sometimes increase certain secondary metabolites. Higher temperatures (35°C/95°F) in lettuce production significantly increase pigment contents including anthocyanins and carotenoids, though this comes at the cost of reduced plant growth (2). This relationship suggests opportunities for strategic temperature manipulation during specific growth phases to optimize product quality.
Practical Management Strategies
Implementing effective root zone temperature management requires understanding both the technical aspects of temperature control and the practical constraints of different growing systems. Successful temperature management strategies must balance plant requirements with economic and energy considerations.
Temperature Monitoring and Control
Accurate temperature monitoring represents the foundation of effective root zone management. Unlike air temperature, which can be measured at any convenient location, root zone temperature must be measured at the actual root interface. This requires placing sensors directly in the growing medium or nutrient solution where roots are actively growing.
For DWC systems, temperature sensors should be placed directly in the nutrient reservoir at root level. In media based systems, sensors should be buried in the growing medium at the depth where the majority of roots are located. Multiple sensors may be necessary in large systems to account for thermal gradients and ensure uniform temperature management.
Heating and Cooling Strategies
Heating strategies for root zone temperature management vary considerably based on the type of hydroponic system and local climate conditions. In DWC systems, submersible aquarium heaters provide reliable and precise temperature control. For media based systems, heating cables or mats can be installed beneath growing containers to provide bottom heat.
Cooling presents greater challenges, particularly in warm climates or heated growing environments. Water chillers represent the most reliable solution for DWC systems but require significant energy investment. For smaller operations, the use of insulation, reflective materials, and strategic shading can help moderate temperature extremes.
Some innovative approaches include using waste heat from LED lighting systems to warm root zones during cooler periods, or incorporating thermal mass materials to buffer temperature fluctuations. These strategies can improve energy efficiency while maintaining optimal growing conditions.
Conclusion
Root zone temperature management represents one of the most impactful yet underutilized tools available to hydroponic growers. The evidence clearly demonstrates that maintaining optimal temperatures can significantly improve plant growth rates, enhance nutrient uptake efficiency, and increase crop quality. However, successful implementation requires careful attention to system specific requirements and the balance between plant needs and pathogen management.
The differences between DWC and soilless media systems necessitate different temperature targets and management strategies. While DWC systems require more restrictive temperature control due to oxygen limitations, soilless media systems offer greater flexibility and thermal stability. Understanding these differences allows growers to optimize their specific systems for maximum productivity.
Perhaps most importantly, the research reveals that root zone temperature should not be considered in isolation but as part of an integrated environmental management strategy. The relationship between root zone and air temperatures, the interaction with dissolved oxygen levels, and the impact on microbial communities all require careful consideration when developing temperature management protocols.
Growing Soilless Crops Without Nitrates: Practical Options When Nitrate Salts Are Unavailable
For growers in regions where geopolitical conflicts or economic constraints limit access to nitrate fertilizers like calcium nitrate and potassium nitrate, the question arises: can you grow hydroponic or soilless crops using only alternative nitrogen sources? The short answer is yes, but with important limitations and necessary substrate modifications. This post explores the science behind nitrate-free soilless growing and practical strategies for growers facing nitrate scarcity.
In conventional hydroponics, 85-95% of nitrogen is supplied as nitrate (NO3-) rather than ammonium (NH4+). This preference exists for good reasons. Plants can safely store nitrate in vacuoles without toxicity, while ammonium accumulation in plant tissues causes rapid damage (1). In soil, nitrifying bacteria convert ammonium to nitrate before plant uptake, but most soilless substrates lack these microbial communities. Without this conversion, ammonium concentrations that would be harmless in soil become highly toxic in hydroponics.
Research on tomatoes shows that plants supplied with 112 ppm nitrogen as ammonium developed severe toxicity symptoms and produced only one-third the biomass of nitrate-fed plants (1). Even at 14 ppm nitrogen, ammonium-only nutrition suppressed growth compared to mixed nitrogen sources. For lettuce, similar effects occur, with crown discoloration and biomass reductions appearing at 50 ppm ammonium nitrogen (2).
Maximum Safe Ammonium Levels
The tolerance threshold varies by species and conditions, but general guidelines exist:
Crop Type
Maximum Safe Ammonium (% of total N)
Maximum Concentration (ppm N)
Most crops (standard)
10-15%
15-30 ppm
Sensitive crops (tomato, pepper, lettuce)
5-10%
10-20 ppm
Cold conditions (<15°C)
0-5%
0-10 ppm
High light, fast growth
15-20%
20-40 ppm
These limits exist because ammonium uptake is passive and rapid, plants cannot regulate it effectively, and it disrupts calcium and magnesium uptake while acidifying the root zone (3).
Substrate Amendments: Creating Artificial Soil
The key to using higher ammonium levels or organic nitrogen sources is establishing nitrifying bacteria in the substrate. Recent research demonstrates that soilless substrates can be inoculated with microbial communities that convert organic nitrogen to nitrate (4).
Effective substrates for nitrification include rockwool, vermiculite, polyurethane foam, oyster shell lime, and rice husk charcoal. The process requires:
Inoculum source: Bark compost or mature vermicompost provides ammonia-oxidizing bacteria (AOB) and nitrite-oxidizing bacteria (NOB). Add 1g per 100mL substrate initially.
Temperature: Nitrifying bacteria function optimally at 25-42°C. Below 15°C, nitrification slows dramatically, causing ammonium accumulation (5).
Humidity and aeration: Substrates need >50% relative humidity and adequate oxygen. Waterlogged conditions inhibit nitrification and promote denitrification.
Establishment period: Allow 2-3 weeks for bacterial colonization before planting. Daily additions of dilute organic fertilizer (6 mg N per 100mL substrate) accelerate establishment.
Practical Nitrogen Sources
Ammonium Salts
Ammonium sulfate ((NH4)2SO4) is the most accessible ammonium source globally. At 21% nitrogen, it provides both N and sulfur. However, use caution:
Never exceed 20% of total nitrogen as ammonium in solution
Monitor substrate pH closely, as ammonium uptake releases protons and acidifies the root zone
Increase ratios only under high light and warm temperatures (>20°C)
Sensitive crops like lettuce, tomato, and pepper tolerate lower ratios
Ammonium phosphate (MAP or DAP) offers nitrogen plus phosphorus but requires even more careful management due to rapid pH shifts.
Urea
Urea (CO(NH2)2) at 46% nitrogen is economical and widely available. In water, urease enzymes (either from bacteria or added exogenously) hydrolyze urea to ammonium. However, hydroponic studies on various crops show that urea performs poorly as a sole nitrogen source (6). Plants fed only urea exhibited nitrogen deficiency symptoms at low concentrations and toxicity at high concentrations. The primary issues are:
Insufficient uptake of intact urea by most crop species
Variable conversion rates without soil bacteria
pH instability during hydrolysis
Combined applications of urea with nitrate showed better results than urea alone, but if nitrates are unavailable, urea offers limited benefit beyond what ammonium salts provide (6).
Compost and Organic Extracts
Compost leachates and vermicompost teas contain nitrogen primarily as proteins, amino acids, and ammonium. Direct use in inert hydroponics fails because plants cannot efficiently absorb complex organic nitrogen. However, two approaches work:
Aerobic nitrification method: Add organic nitrogen sources like corn steep liquor (1g/L) or fish emulsion plus bark compost (0.5g/L) as bacterial inoculum. Aerate for 12 days, during which bacteria convert organic N and ammonium to nitrate, reaching 100-130 ppm N as nitrate (7). This creates a low-cost, nitrate-containing solution from readily available materials.
Substrate-based mineralization: Inoculate substrates with compost microbes and apply dilute organic fertilizers daily. The substrate acts as a biofilter, mineralizing organic N to nitrate before plant uptake (4). This method requires 2-3 weeks establishment and careful moisture management.
Expected Yield Impacts
When managed properly with substrate amendments and bacterial communities, yields can approach conventional hydroponic levels. Studies show that tomatoes grown with nitrified organic solutions performed comparably to mineral fertilizer controls when adequate nitrate was generated (7).
However, several factors reduce yields in poorly managed nitrate-free systems:
Ammonium toxicity: High ammonium causes 30-70% yield reductions across most crops (1)
Nutrient imbalances: Ammonium competes with Ca2+ and Mg2+ uptake, inducing deficiencies
pH instability: Root zone acidification from ammonium uptake reduces nutrient availability
Incomplete mineralization: Organic N sources may not fully convert to plant-available forms
Realistic expectations for growers transitioning to nitrate-free systems:
First crop cycle: 50-70% of conventional yields while optimizing conditions
Established systems with functioning bacterial communities: 80-95% of conventional yields
Cold season growing (<15°C): 40-60% due to impaired nitrification
Nutrient Solution Modifications
Without calcium nitrate, calcium must come from chloride or sulfate sources rather than nitrate. Calcium chloride is highly soluble but adds chloride. Gypsum (calcium sulfate) doesn’t have the solubility needed to make concentrated stock solutions and therefore can only be added to the final solutions or added to the media as an amendment. Calcium chloride can add unwanted high amounts of chlorides as it’s therefore best avoided. If you are doing composting amendments then limestone amendments might be the most desirable way to supply Ca to the crop.
Critical Success Factors
To successfully grow soilless crops without nitrate fertilizers:
Establish nitrifying bacteria: This is non-negotiable for using organic N or high ammonium levels
Monitor pH constantly: Ammonium acidifies solutions; maintain pH 5.8-6.5 through buffering or base addition
Provide adequate calcium: Use calcium chloride or sulfate since calcium nitrate is unavailable
Keep temperatures warm: >20°C substrate temperature for bacterial activity
Start conservatively: Begin with 10% ammonium and increase gradually as plants adapt
Choose tolerant species first: Leafy greens like pak choi are more tolerant than tomatoes or peppers
Conclusion
Growing soilless crops without nitrates is achievable but requires different management than conventional hydroponics. The approach depends on creating conditions that mimic soil processes, establishing microbial communities to convert ammonium and organic nitrogen to nitrate within the substrate. While yields may initially be lower, proper substrate inoculation, temperature management, and careful nitrogen source selection can produce acceptable results. For growers with limited access to nitrate salts, combining small amounts of ammonium sulfate (20-30 ppm N) with aerobically nitrified compost teas or inoculated substrates offers the most practical path forward.
Comparing Nutrient Solutions for Hydroponic Strawberry Production
Getting the right nutrient solution for strawberries in hydroponics can feel like trying to solve a puzzle where every piece matters. Unlike many crops where you can get away with a generic formula, strawberries are particularly responsive to nutrient composition, especially when it comes to the balance between nitrogen and potassium. Today, we will explore how different nutrient formulations affect both yield and fruit quality in soilless strawberry production.
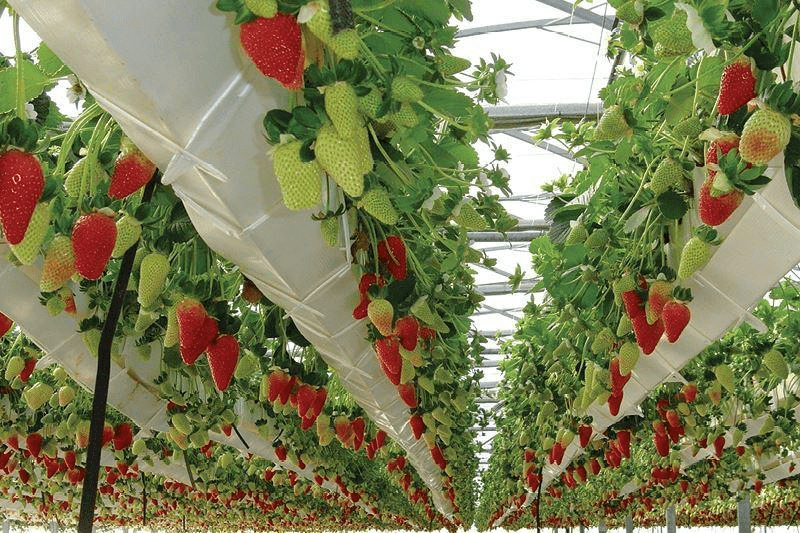
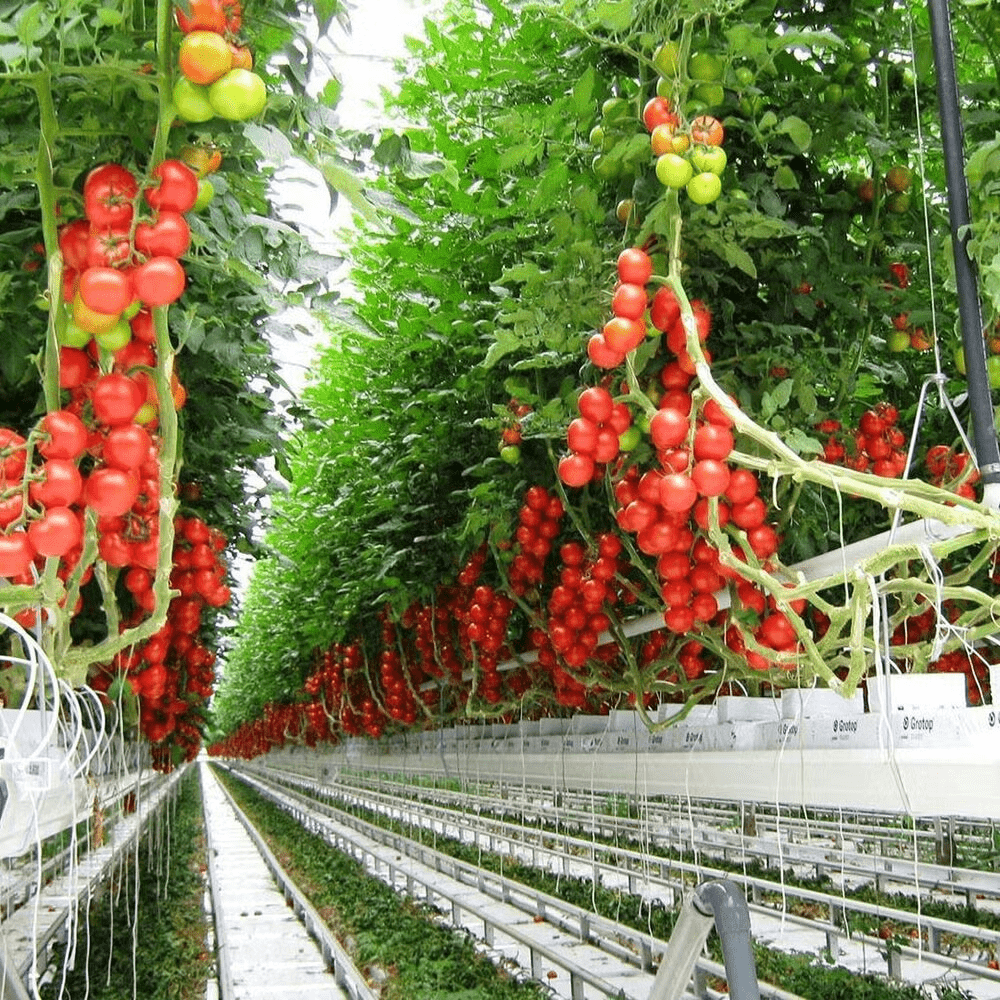
A hydroponic strawberry production greenhouse
The Modified Steiner Approach
When researchers at the Technological Institute of Torreón tested different nitrogen and potassium combinations in strawberries, they discovered something important about how these two nutrients interact. Using a (1) modified version of Steiner’s Universal Nutrient Solution, they evaluated twelve different formulations with nitrogen ranging from 126 to 210 ppm and potassium from 195 to 430 ppm.
The results were revealing. Plants receiving 168 ppm nitrogen combined with 430 ppm potassium achieved yields of 114 grams per plant, which was significantly higher than lower nitrogen treatments. However, here is where it gets interesting: while high nitrogen boosted yield, it actually decreased fruit quality. The highest soluble solids content (10.5 degrees Brix) occurred at the lowest nitrogen level of 126 ppm. This creates a real dilemma for growers who want both high yields and premium quality fruit.
Solution Type
N (ppm)
P (ppm)
K (ppm)
Ca (ppm)
Mg (ppm)
Yield
Quality Impact
Modified Steiner (Low N)
126
46
195
449
121
89.3 g/plant
Highest Brix (10.5°)
Modified Steiner (Medium N)
168
32
273
360
97
108 g/plant
Moderate Brix (10.0°)
Modified Steiner (High N)
210
19
194
413
111
111 g/plant
Lowest Brix (9.5°)
The Critical Role of Potassium
What emerged from this study was potassium’s profound impact on fruit quality. When potassium was increased to 430 ppm, the soluble solids climbed to 10.6 degrees Brix, and phenolic compounds reached their peak as well. The (1) research showed that the optimal combination for maximizing both yield and nutraceutical quality was 168 ppm nitrogen with 430 ppm potassium, resulting in antioxidant capacity of 6305 microequivalents of Trolox per 100 grams.
This makes physiological sense. Potassium plays a fundamental role in sugar transport through the phloem, and when potassium availability is adequate, more sugars accumulate in the fruit. Meanwhile, excessive nitrogen tends to promote vegetative growth and the synthesis of nitrogen containing compounds like proteins and amino acids, rather than the accumulation of secondary metabolites that contribute to fruit quality.
Optimizing NPK Ratios for Chinese Greenhouses
A comprehensive study from China Agricultural University took a different approach by examining the combined effects of nitrogen, phosphorus, potassium, and water on strawberry production. Using a (2) quadratic regression design with 36 treatments, researchers determined that nitrogen was by far the most important factor, followed by water, then phosphorus, with potassium having the least impact on the sweetness to acidity ratio.
Their optimal formulation for achieving yields above 110 grams per plant with excellent fruit quality included nitrogen at 156 to 172 ppm (supplied as calcium nitrate), phosphorus at 54 to 63 ppm (as sodium dihydrogen phosphate), and potassium at 484 to 543 ppm (from potassium sulfate). This represents significantly higher potassium levels than the Steiner based formulations, suggesting that when other nutrients are optimally balanced, strawberries can benefit from even more potassium.
Nutrient
Optimal Range (ppm)
Impact on Yield
Impact on Quality (SSC/TA)
Nitrogen (N)
156 to 172
Most significant positive effect
Most significant factor
Phosphorus (P)
54 to 63
Moderate positive effect
Second most important
Potassium (K)
484 to 543
Significant positive effect
Minimal impact
Water
12.0 to 13.1 L/plant
Second most important
Third most important
The Calcium and Electrical Conductivity Question
While much attention focuses on NPK ratios, calcium concentration matters enormously in strawberry production. In the modified Steiner solutions, calcium ranged from (1) 244 to 449 ppm depending on the treatment. Higher calcium levels corresponded with lower nitrogen and potassium concentrations, maintaining appropriate osmotic potential.
Research has shown that the electrical conductivity (EC) of the nutrient solution significantly impacts strawberry performance in soilless culture. Studies using different EC levels found that (3) 1.3 mS/cm was optimal for spring production, while 2.2 mS/cm proved better during winter months. This seasonal adjustment reflects the plant’s changing water use and nutrient demand patterns throughout the growing cycle.
Micronutrient Considerations
While macronutrients get most of the attention, micronutrient composition matters too. The (1) modified Steiner formulations included iron at 5 ppm, manganese at 1.6 ppm, boron at 0.865 ppm, zinc at 0.023 ppm, copper at 0.11 ppm, and molybdenum at 0.048 ppm. These concentrations remained constant across all treatments, suggesting that within reasonable limits, macronutrient balance has a more pronounced effect on yield and quality than micronutrient variation.
Making Practical Choices
So what should you actually do with this information? If you are growing strawberries hydroponically and want to maximize both yield and quality, consider starting with a solution containing approximately 160 to 170 ppm nitrogen, 55 to 60 ppm phosphorus, and 400 to 500 ppm potassium. Maintain the K:Ca ratio near 1-1.4:1 and the K:Mg ratio near 4:1. This matches some of my previous publications on the K:Ca ratio.
Remember that these recommendations assume you are maintaining appropriate pH (around 5.5 to 6.0) and EC levels suitable for your growing conditions. The (2) research demonstrated that excessive nutrients actually decreased both yield and quality, so more is definitely not better. You will need to adjust based on your specific cultivar, climate, and growing system, but these ranges provide a solid starting point backed by peer reviewed research.
The key takeaway is that strawberry nutrition in hydroponics requires a delicate balance. While nitrogen drives yield, potassium enhances quality, and the interaction between these two nutrients determines your ultimate success. Monitor your plants carefully, conduct tissue analysis when possible, and do not be afraid to adjust your formulation based on what the plants are telling you.
Comparing Nutrient Solutions for Hydroponic Tomatoes
When growing tomatoes hydroponically, one of the most critical decisions you’ll make is choosing the right nutrient solution. The composition of your nutrient solution can dramatically affect both the quantity and quality of your harvest. In this post, I’ll examine different nutrient formulations that have been tested in scientific studies and discuss how they impact tomato production in soilless systems.
Picture of a soilless tomato greenhouse
Understanding Nutrient Solution Basics
Before diving into specific formulations, it’s important to understand that tomato plants have changing nutritional needs throughout their growth cycle. Research has shown that early in the season, excessive nitrogen can cause plants to become too vegetative, resulting in bullish growth that produces misshapen fruits and increases susceptibility to disease (1). High potassium levels can also create problems by interfering with calcium and magnesium absorption, leading to blossom end rot.
Most successful nutrient programs divide the growing season into distinct stages. The seedling stage requires lower concentrations of nutrients, particularly nitrogen, while mature fruiting plants need substantially higher levels of most nutrients to support both vegetative growth and fruit development (2).
Comparing Two Common Formulations
Research has established several effective nutrient formulations for hydroponic tomatoes. I’ll compare two well documented approaches that represent different philosophies in nutrient management.
Nutrient
Arizona Formula (Seedling)
Arizona Formula (Fruiting)
Florida Formula (Early)
Florida Formula (Late)
Nitrogen (N)
113 ppm
144 ppm
60 to 70 ppm
150 to 200 ppm
Phosphorus (P)
62 ppm
62 ppm
39 ppm
39 ppm
Potassium (K)
199 ppm
199 ppm
200 ppm
300 to 400 ppm
Calcium (Ca)
122 ppm
165 ppm
150 to 200 ppm
150 to 200 ppm
Magnesium (Mg)
50 ppm
50 ppm
48 ppm
48 ppm
The Arizona formulation (2) maintains relatively consistent macronutrient levels between growth stages, with only modest increases in nitrogen and calcium as plants mature. In contrast, the Florida approach (1) uses much lower nitrogen during early growth to prevent bullishness, then dramatically increases both nitrogen and potassium during fruit production.
Micronutrient Requirements
While macronutrients often receive the most attention, micronutrients are equally essential for healthy tomato production. These elements remain fairly constant throughout the growing cycle (2). Standard micronutrient concentrations for hydroponically grown tomatoes include iron at 2.5 ppm, manganese at 0.62 ppm, boron at 0.44 ppm, zinc at 0.09 ppm, copper at 0.05 ppm, and molybdenum at 0.06 ppm.
Micronutrient
Concentration (ppm)
Iron (Fe)
2.5
Manganese (Mn)
0.62
Boron (B)
0.44
Zinc (Zn)
0.09
Copper (Cu)
0.05
Molybdenum (Mo)
0.06
The Impact of Nitrogen Supply on Quality
Research on nitrogen management has revealed some surprising findings. A study examining nitrogen supply at different growth stages found that increasing nitrogen from 140 to 225ppm during the vegetative stage increased protein, vitamin C, and sugar content in fruits (3). However, the effect on lycopene and beta-carotene depended heavily on the potassium supply during the reproductive stage.
Other research examining lower nitrogen levels has shown that minimal nitrogen supply can actually enhance lycopene content in tomato fruits, particularly when coupled with sufficient water supply (4). Studies in hydroponic culture have demonstrated that either the lowest or medium levels of nitrogen application produced the best lycopene content, suggesting that optimal nitrogen levels for antioxidant production may be lower than those for maximum yield.
Potassium’s Role in Fruit Quality
Potassium plays a fundamental role in determining tomato fruit quality. Research has demonstrated that increasing potassium supply during the reproductive stage significantly enhances sugar concentration, vitamin C content, protein levels, lycopene, and beta-carotene in tomato fruits (3). The effect is particularly pronounced when potassium levels increase from 200 to 500ppm.
Another comprehensive study found that high proportions of potassium in the nutrient solution increased quality attributes including fruit dry matter, total soluble solids content, and lycopene content (5). However, these same researchers found that high proportions of calcium improved tomato fruit yield and reduced the incidence of blossom end rot, highlighting the importance of balancing these two nutrients.
Electrical Conductivity Management
One of the most innovative approaches to nutrient management involves carefully controlling the electrical conductivity (EC) of the nutrient solution. A study in closed NFT (Nutrient Film Technique) systems examined three different EC replacement set points: 5, 7.5, and 10 mS/cm (6). Remarkably, the highest EC replacement set point produced yields equivalent to lower EC treatments while significantly improving fruit quality.
The higher EC replacement threshold resulted in better dry matter content and total soluble solids in berries. Additionally, it demonstrated superior environmental sustainability by reducing total nutrients discharged into the environment by 37% compared to the medium EC treatment and 59% compared to the low EC treatment (6). This approach challenges conventional thinking about salinity stress in tomato production.
Calcium Management and Blossom End Rot
Calcium nutrition presents one of the most common challenges in hydroponic tomato production. Blossom end rot, characterized by dark lesions on the blossom end of fruits, results from calcium deficiency in developing fruits. However, this deficiency often occurs even when calcium levels in the nutrient solution appear adequate (1).
The problem frequently stems from antagonism between nutrients. Excessive potassium in the nutrient solution can interfere with calcium uptake by plant roots. This is particularly problematic early in the season when using pre-mixed fertilizers that contain high potassium levels. Growers working with water containing less than 50 ppm calcium need to be especially cautious about potassium concentrations.
To minimize blossom end rot, it’s critical to maintain calcium levels between 150 and 200 ppm while keeping early season potassium levels moderate. Some growers supplement calcium nitrate with calcium chloride to increase calcium availability without adding more nitrogen. Each pound of calcium chloride (36% Ca) in 30 gallons of stock solution increases calcium concentration by approximately 14 ppm in the final nutrient solution when injected at a 1% rate (1).
Effects on Yield and Quality Parameters
The differences between nutrient formulations can significantly impact both yield and fruit quality. Research consistently shows that inadequate nitrogen during fruiting stages produces lower yields, though the fruits may have better sugar content and flavor. Conversely, excessive nitrogen can produce abundant foliage at the expense of fruit production (4).
Potassium levels have a pronounced effect on fruit quality parameters. Adequate potassium improves fruit firmness, color development, and sugar content (3). However, excessive potassium can lead to calcium and magnesium deficiencies that compromise both yield and quality.
The timing of nutrient adjustments also matters significantly. Studies have shown that gradually increasing nutrient concentrations as plants transition from vegetative to reproductive growth produces better results than sudden changes in formulation. Plants that experience consistent, appropriate nutrition throughout their lifecycle typically show improved yields and more uniform fruit quality (6).
Practical Considerations
When implementing a nutrient program, several practical factors deserve consideration. Water quality plays a fundamental role in determining how much of each nutrient to add. Wells in many regions naturally contain significant calcium and magnesium, sometimes providing 40 to 60 ppm calcium (1). These naturally occurring nutrients should be factored into your formulation calculations.
The pH of your nutrient solution also affects nutrient availability. Research has established that maintaining pH between 5.5 and 6.0 ensures optimal nutrient uptake (2). Water with high alkalinity requires acidification, which can be accomplished using phosphoric acid or sulfuric acid depending on your phosphorus requirements.
The type of hydroponic system you’re using may also influence your nutrient concentrations. Systems requiring fewer daily irrigation cycles may need higher nutrient concentrations to ensure plants receive adequate nutrition. The general principle is that nutrient concentrations should be higher in systems with less frequent fertigation compared to those with continuous or very frequent feeding (1).
Advanced Management: The Transpiration-Biomass Ratio
One of the most sophisticated approaches to nutrient management involves calculating a recovery solution based on the transpiration-biomass ratio (6). This method recognizes that the relationship between water use and dry matter production changes throughout the growing cycle.
Research has shown that the transpiration-biomass ratio is high early in the crop cycle (approximately 300 liters per kilogram of dry weight), decreases during mid-season to a relatively stable phase, and then increases again late in the season (up to 400 liters per kilogram). This pattern suggests that nutrient concentrations should be adjusted accordingly: lower concentrations in the first and last phases, and higher concentrations during the middle phase when biomass accumulation is most rapid.
Conclusion
Successful hydroponic tomato production requires careful attention to nutrient solution composition. While several proven formulations exist, the research clearly shows that no single approach works best for all situations. The Florida formulation with its conservative early nitrogen levels may be ideal for preventing bullishness in greenhouse production, while higher EC strategies can improve fruit quality in closed systems.
Key takeaways from the scientific literature include: maintain nitrogen between 60 and 70 ppm early in the season to prevent excessive vegetative growth, increase potassium substantially during fruiting to enhance quality parameters, keep calcium between 150 and 200 ppm throughout the season while monitoring potassium levels to prevent antagonism, and consider that higher EC values (up to even 10 mS/cm) may be feasible limits for nutrient solution replacement in recirculating systems.
Starting with a well researched base formulation and making careful adjustments based on plant response, tissue analysis, and your specific growing conditions provides the most reliable path to optimizing both yield and quality in your hydroponic tomato crop. The scientific evidence demonstrates that nutrient management is not a one-size-fits-all proposition, but rather a dynamic process that should respond to both plant developmental stage and environmental conditions.
pH vs Nutrient Availability: Rethinking the Classic Charts
If you’ve been around hydroponics long enough, you’ve probably seen the ubiquitous “pH vs nutrient availability” chart. It usually looks like a series of colored bars, each showing how available a nutrient supposedly is across a pH range. The bars are wide for some nutrients at certain pH values, narrow for others, and the chart often comes with a moral: keep your solution pH between 5.5 and 6.5.
I discussed some of these issues in a previous post, but it’s worth revisiting them here with a clearer chart. The problem is that most of these charts trace back to soil agronomy research from the 1930s and 1940s. They’re not based on solution chemistry relevant to hydroponics. They conflate microbial activity, lime chemistry, and plant physiology with solubility. And, in some cases, they are flat out misleading.
Let me talk about why the traditional chart is wrong, what modern chemistry tells us, and how a more honest representation looks.
Where the Old Charts Went Wrong
The historical diagrams were designed for soils, not hydroponic solutions. For example:
Nitrate (NO₃⁻): In many charts, nitrate availability appears to fall off at low pH. In reality, nitrate is completely soluble across any reasonable pH range. The “loss” in those charts comes from soil microbial nitrification shutting down under acidic conditions, not relevant when you’re directly dosing nitrate salts in solution.
Calcium (Ca) and Magnesium (Mg): Old charts show Ca and Mg as always available at high pH. But that ignores precipitation with phosphate or carbonate, which can start as low as pH 6.2 for Ca. The old charts show high Ca and Mg availability at high pH because the high pH in soils was usually achieved by the addition of dolomite or lime, which greatly increased Ca and Mg concentrations in soil, this is not the case in a soilless setup.
Micronutrients (Fe, Mn, Zn, Cu): These are shown as less available above neutral pH, which is true for unchelated forms (they hydrolyze and precipitate quickly). But in hydroponics, I typically use chelates, and their stability extends availability well above pH 7.
Phosphorus (P): Charts often suggest a broad plateau around pH 6 to 7. In truth, phosphate solubility is sharply influenced by calcium concentration and carbonate alkalinity. The idea of a universal “wide bar” is misleading.
These errors matter. They lead growers to overemphasize the magic 5.5 to 6.5 range without appreciating that different nutrients behave differently, and that chelation or precipitation risks can change the picture entirely.
Building a Better Chart
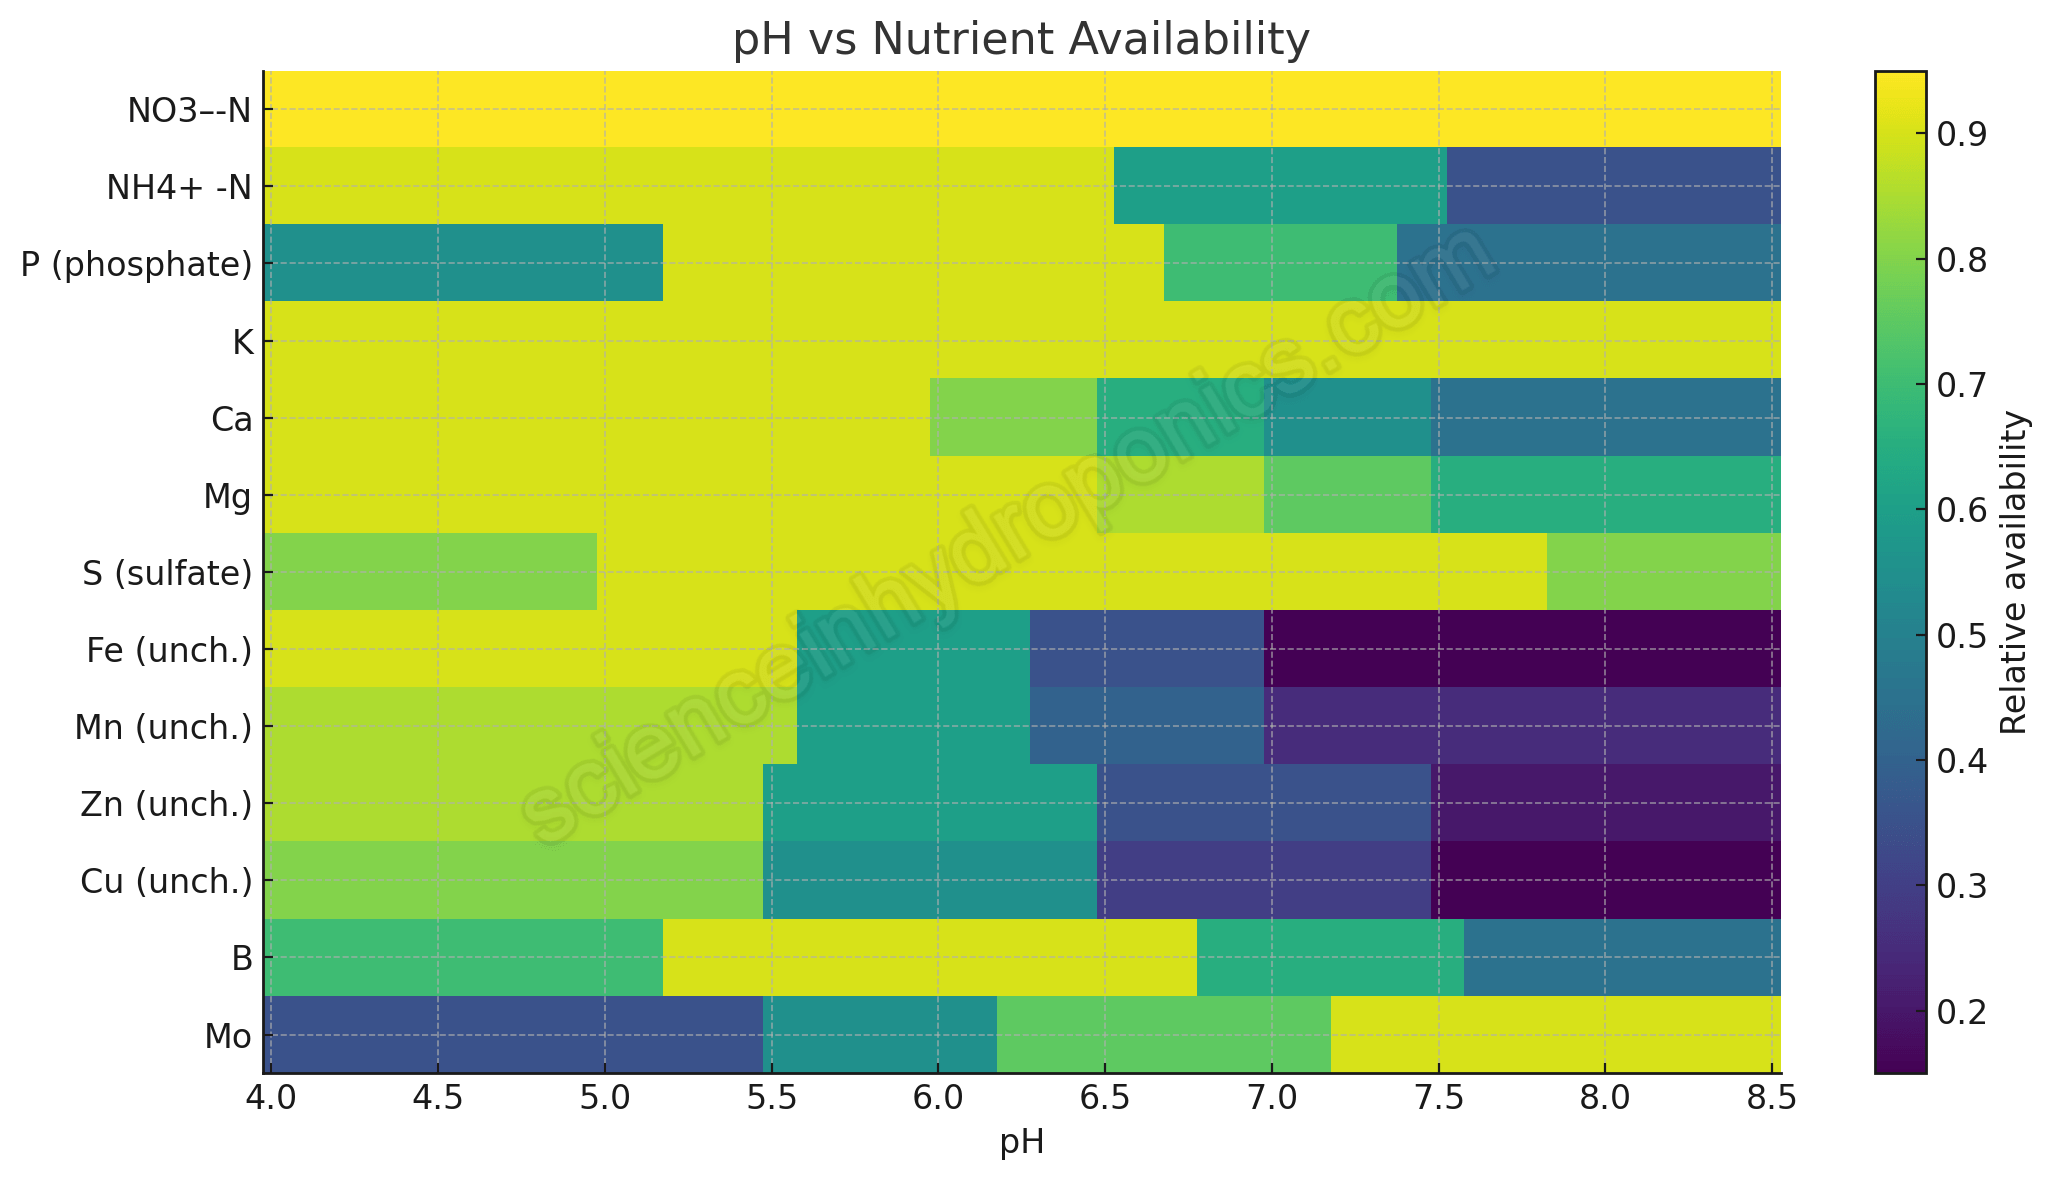
To improve on the old diagrams, I constructed a new heatmap. Instead of arbitrary bar widths, each nutrient’s relative availability (scaled from 0 = low to 1 = high) is modeled based on actual solubility, speciation, and chelation chemistry. The chart covers pH 4.0 to 8.5.
Updated chart I created for nutrient availability in soilless systems based on chemical and plant physiology principles
This chart is not an absolute quantitative prediction (real world systems have variations depending on concentration, alkalinity, chelate type, etc.). But it captures the directional chemistry more honestly. For nutrients that are effectively pH independent (like nitrate), the line is flat. For those that crash with pH (like unchelated iron), the line drops. And for Ca and Mg, I’ve introduced tapering to reflect phosphate precipitation behavior.
Nutrient by Nutrient Ranges
Here’s a summary table describing the approximate pH behavior, the range of best availability, and the underlying reason:
Nutrient
Broad Availability Range
Notes / Reason
NO₃⁻-N
4.0 to 8.5
Soluble across all relevant pH; uptake independent of pH in hydroponic solution. Old charts confused microbial nitrification with solubility.
NH₄⁺-N
Best <6.5; declines >7.0
At higher pH, conversion to unionized NH₃ increases, which is less available and potentially toxic.
Phosphorus (P)
Peak 5.5 to 6.5; drops <5.2 and >7.0
Solubility falls at high pH due to Ca+P precipitation (starting ~6.2); also limited at low pH by fixation and speciation.
Potassium (K)
4.0 to 8.5
Monovalent cation, highly soluble, minimal precipitation issues (sometimes K containing silicates at higher pH values)
Calcium (Ca)
Stable <6.0; declining >6.2
Precipitates with phosphate and carbonate as pH rises; availability falls gradually above ~6.2.
Magnesium (Mg)
Stable <6.5; mild decline >7.0
Mg+P precipitation is less aggressive than Ca+P; solubility loss is slower but still possible at higher pH.
Sulfate (SO₄²⁻)
Broad 4.5 to 8.0
Generally soluble. At very low pH, some soils can adsorb sulfate due to protonated variable charge surfaces, reducing availability. At very high pH, reduced root uptake efficiency and competition with other anions can occur; in concentrated Ca²⁺ + SO₄²⁻ systems gypsum may precipitate by saturation.
Iron (Fe, unchelated)
Max <5.5; falls sharply >6.0
Fe³⁺ hydrolyzes and precipitates as hydroxides and oxides above ~pH 6; nearly unavailable by pH 7.
Manganese (Mn, unchelated)
Best <6.0; declining >6.3
Mn²⁺ oxidizes and precipitates above neutral pH.
Zinc (Zn, unchelated)
Best <6.0; low >7.0
Zn²⁺ solubility decreases with increasing pH; precipitates as hydroxide/carbonate.
Copper (Cu, unchelated)
Best <6.0; poor >7.0
Cu²⁺ strongly hydrolyzes, falls out of solution quickly with rising pH.
Boron (B)
Best 5.5 to 6.8
Boric acid is readily available in this range; at higher pH, more borate forms, reducing uptake.
Molybdenum (Mo)
Improves >6.0
Molybdate solubility increases with pH; plants often deficient in acidic conditions, more available at neutral/alkaline pH.
The Ca vs Mg Difference
A key improvement over older charts is distinguishing calcium from magnesium. While both can precipitate with phosphate, their behaviors differ:
Ca+P precipitation is strong and begins around pH 6.2, especially in solutions with 1 to 3 mM phosphate. Brushite, dicalcium phosphate, and hydroxyapatite phases progressively reduce solubility.
Mg+P precipitation is slower and less pronounced. Mg²⁺ is more strongly hydrated and less eager to form insoluble phosphates. It tends to stay soluble longer, only declining gently above pH 7.
Chelation: The Missing Dimension
My chart above shows unchelated forms. In real hydroponics, Fe, Mn, Zn, and Cu are almost always chelated. Depending on the chelate (EDTA, DTPA, EDDHA, HBED), stability can be maintained up to pH 7.5 to 9. This dramatically extends availability, particularly for Fe. A separate chart is needed to show chelated behavior.
Why This Matters
So why obsess about getting this chart right?
Because oversimplified charts lead to oversimplified thinking. If you believe nitrate solubility collapses below pH 6, you might panic when your reservoir drifts to 5.2, even though NO₃⁻ is unaffected. If you believe Ca is “always available,” you might miss that phosphate precipitation is happening in your tank right now at pH 6.3. And if you don’t distinguish between chelated and unchelated micronutrients, you’ll misdiagnose deficiencies.
A better chart isn’t just about scientific pedantry. It’s about helping growers make better decisions: when to acidify, when to buffer, when to choose a stronger chelate, and when to worry (or not worry) about a drifting pH.
Final Thoughts
The classic nutrient pH charts had their place in teaching basic agronomy 80 years ago. But hydroponics deserves more precision. Nutrients don’t all behave the same way. Some are flat across the entire range (NO₃⁻, K). Some rise or fall gradually (B, Mo, Mg). Others are brutally sensitive (Fe without chelates). And precipitation interactions mean that Ca and phosphate availability are tied together, not independent.
This new heatmap and the accompanying table aren’t the last word, they’re a more honest starting point. The real message is: understand the chemistry, not just the cartoon.
Can you manage downy mildew in hydroponic basil with organic foliar sprays?
Basil downy mildew, caused by the obligate oomycete Peronospora belbahrii, has become one of the most serious diseases affecting hydroponic and greenhouse basil production globally. The pathogen, first documented in Europe in 2001 and later detected in the United States in 2007, requires high relative humidity (at least 85%) or wet leaves to infect plants (1). Temperature preferences favor moderate conditions around 20°C rather than higher temperatures, which explains why the disease thrives in controlled environment systems where leaf wetness and humidity are difficult to manage (1).
Downy mildew in basil shows characteristic black marks on the underside of leaves
Understanding the infection process is critical for designing effective spray programs. Under conditions of continuous free moisture, sporangia germinate within 3 to 5 days by producing germ tubes that penetrate basil leaves directly through the epidermis, typically without entering through stomata (2). Seven days after initial infection, sporangiophores bearing new sporangia emerge through stomata on both the upper and lower leaf surfaces, creating secondary inoculum that spreads rapidly throughout greenhouse facilities (2). This relatively short cycle from infection to sporulation means that preventive measures must start before visible symptoms appear.
Multiple field trials evaluating organic fungicides have delivered sobering results for growers seeking alternatives to conventional chemistry. A comprehensive study testing products approved for organic production, including copper octanoate, hydrogen dioxide, sesame oil, neem oil, thyme oil, citric acid, Bacillus species, and Streptomyces lydicus, found that none were effective at controlling downy mildew when applied to susceptible basil cultivars (3). Applications were made weekly starting before symptom development, and efficacy was assessed based on incidence of symptomatic leaves rather than severity, reflecting the zero tolerance for disease on fresh market herbs (3). A summary of the tested fungicides and their effectiveness is shown on the following table.
Product (Active Ingredient)
Mode of Action
Effectiveness
Cueva (Copper octanoate)
Contact fungicide, disrupts enzyme function
Ineffective
OxiDate (Hydrogen dioxide)
Oxidizing agent, contact action
Ineffective
Organocide (Sesame oil)
Physical barrier, suffocation
Ineffective
Trilogy (Neem oil)
Physical barrier, azadirachtin content
Ineffective
Forticept EP #1 (Thyme oil)
Essential oil, contact action
Ineffective
Procidic (Citric acid)
pH modulation, contact action
Ineffective
Actinovate (Streptomyces lydicus)
Biocontrol, competitive colonization
Ineffective
Companion (Bacillus subtilis)
Biocontrol, induced resistance
Ineffective
Double Nickel (B. amyloliquefaciens)
Biocontrol, antibiosis
Ineffective
Regalia (Reynoutria sachalinensis)
Plant defense activator
Ineffective
The limited efficacy of organic fungicides appears related to the aggressive nature of the pathogen and the difficulty of achieving thorough foliar coverage in dense basil canopies. Even when combined with resistance inducers or natural products, organic treatments failed to provide commercially acceptable levels of disease suppression (5).
Environmental management offers more promise than chemical sprays alone. Light suppresses sporulation of P. belbahrii, with continuous light or supplemental lighting during nighttime hours substantially reducing spore production (6). Growers can exploit this by maintaining photoperiods longer than 13 hours or by using low-intensity supplemental lighting during dark periods. Reducing leaf wetness duration is equally important because the pathogen requires at least 24 hours of continuous moisture for infection and dense sporulation (7). In hydroponic systems, switching from overhead misting to sub-canopy irrigation and increasing air movement with horizontal airflow fans can dramatically reduce infection pressure (8).
Temperature manipulation provides another non-chemical tool. Passive heat treatment using transparent plastic covers to raise greenhouse temperatures during sunny periods suppressed downy mildew development without damaging basil plants (9). Temperatures above 30°C inhibit sporangiophore formation and sporangial germination, though plants must be acclimated gradually to avoid heat stress. This approach works best in greenhouse operations with sufficient ventilation control and may be less practical in open hydroponic facilities.
Varietal resistance remains the most effective long-term strategy for hydroponic basil growers. Breeding efforts have identified resistance sources in wild basil species Ocimum americanum, and these traits have been successfully transferred into sweet basil backgrounds (10). Commercial varieties with improved resistance are now available, though complete immunity has not been achieved. Growers should prioritize these resistant cultivars and combine them with environmental controls rather than relying on organic fungicide sprays.
Cropping system modifications can reduce disease pressure in organic systems. Research on open field organic production found that sparse sowing density combined with resistant varieties provided better control than chemical treatments alone (11). In hydroponics, maintaining wider plant spacing, particularly in NFT or DWC systems where humidity tends to be higher, allows better air circulation and faster leaf drying after irrigation events.
The reality for hydroponic basil producers is that organic foliar sprays, when used alone, will not provide adequate downy mildew control on susceptible varieties. The pathogen’s rapid lifecycle, preference for humid greenhouse conditions, and resistance to contact fungicides makes chemical intervention largely ineffective without supporting measures. Successful organic management requires integrating resistant varieties, environmental manipulation (particularly light, humidity, and leaf wetness control), appropriate plant spacing, and vigilant monitoring for early disease detection. Growers who continue relying primarily on organic sprays should expect continued losses, while those who adopt integrated approaches combining genetics and environment will achieve better results.
Calcium silicate (wollastonite) in soilless crops
Silicon in media is not a magic switch. In soilless systems it can help, it can do nothing, and at the wrong rate or pH it can hurt. Calcium silicate sources such as wollastonite release plant-available Si into inert substrates and typically raise pH, which is useful in peat but potentially more risky in coir or already alkaline systems. A recent substrate study quantified this clearly: wollastonite steadily released Si for months and increased media pH about 0.5 to 1 unit depending on substrate composition (1). With that in mind, here is the evidence for tomatoes and cucumbers grown without soil, focusing only on media or root-zone applications.
Vansil CS-1, one of the most common forms of calcium silicate (wollastonite) used as an amendment in soilless crops.
Tomatoes
Two independent Brazilian groups that amended substrate with calcium silicate found quality benefits but also rate-sensitivity. In a factorial test across Si sources and doses, calcium silicate treatments improved postharvest durability and maintained physicochemical quality of fruits; the effect size depended on the source and the dose used (2). A protected-environment pot study that mixed calcium silicate into the substrate before transplanting reported reductions in gas exchange and chlorophyll at midcycle at higher rates, a warning that more is not always better (3). Earlier yield work that compared sources also detected response to silicon fertilization in tomatoes, but the magnitude varied with rate and material (4).
Cucumbers
When wollastonite was incorporated into the soilless substrate, 3 g L⁻¹ increased yield by ~25% under moderate moisture restriction, with no penalty to soluble solids or fruit size. Lower doses or excessive irrigation did less (5). A separate work that applied a calcium-silicate solution into the substrate showed small gains in biomass under specific moisture regimes and no change in soluble solids, again pointing to context and dose as the deciding factors (6).
Practical takeaways for media use
Treat calcium silicate like a weak liming Si source. Expect a pH rise. In peat this can be helpful, in coir or high-alkalinity waters it can push you out of range (1).
Dose conservatively, then verify with tissue Si or leachate pH before scaling. Tomatoes show rate-sensitive physiology (3).
Target crops and situations with the strongest evidence. Cucumbers under moderate moisture restriction and strawberries in organic substrates show the clearest yield and quality benefits (5), (7).
Summary table – media or root-zone Si only
Crop
Medium and Si source
Application rate
Positive effects on yield or quality
Reported negatives
Ref
Tomato
Substrate mix, calcium silicate among Si sources
Field-equivalent 0 to 800 kg SiO₂ ha⁻¹ mixed pre-plant
Improved postharvest durability and maintained physicochemical quality vs control; effect depended on dose and source
Use calcium silicate where the crop and context justify it, not by default. For cucumbers and strawberries the upside on yield and quality is most consistent when Si is in the root zone. For tomatoes, treat calcium silicate as a quality tool with a narrow window and verify plant response; higher rates can backfire physiologically. If you want to try calcium silicate, mix wollastonite with your media at a rate of 3g L⁻¹, then test the effect on pH and Si in tissue.
A low cost DIY oil IPM for your crops
An emulsified vegetable oil spray can smother mites and soft-bodied insects and can suppress powdery mildew if you actually coat the target. Soybean oil has the strongest evidence. Corn oil works too, and blending the two offers some advantages. In the following article I tell you how to prepare such a spray as well as some of the scientific evidence showing how it works.
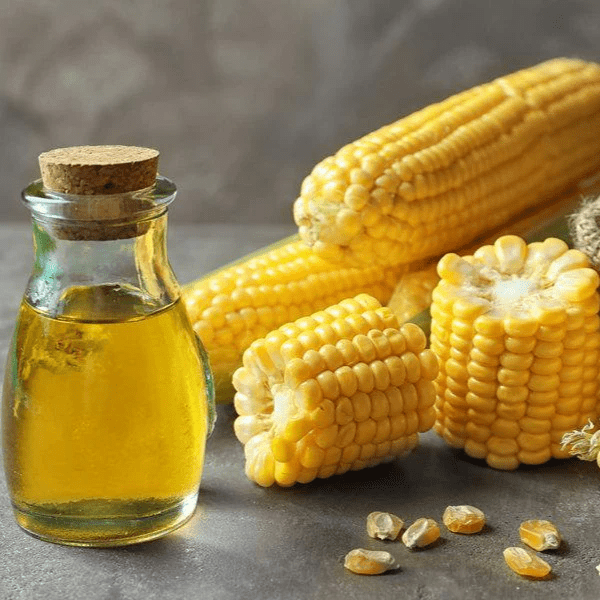
Corn oil, one of the main components of this IPM spray
Why combine soybean and corn oil?
Fatty acid profiles differ. Soybean oil is richer in unsaturated fatty acids (linoleic, linolenic), while corn oil contains more oleic and palmitic. That mix can change the viscosity and spreading behavior on leaves.
Broader efficacy. Soybean oil has strong data against powdery mildew, mites, and whiteflies (1)(2)(3). Corn oil has been validated in cucumber mildew trials (5). Using both hedges against variability between pests and crops.
Physical properties. Mixed oils can emulsify more easily and form finer droplets than a single oil, which may improve coverage and reduce visible residues.
Why use both Tween 20 and Tween 80?
Hydrophilic balance. Tween 20 (polyoxyethylene sorbitan monolaurate) is more hydrophilic, while Tween 80 (polyoxyethylene sorbitan monooleate) is more lipophilic. Together, they stabilize emulsions of mixed triglyceride oils better than either one alone.
Reduced creaming/separation. A dual-Tween system forms smaller, more stable droplets that resist breaking apart. This means the concentrate stays uniform longer and the spray deposits more evenly on foliage (4).
Step 1. Prepare the concentrate
Mix in a clean container:
Soybean oil: 200 mL per liter (~760 mL per US gallon)
Corn oil: 200 mL per liter (~760 mL per US gallon)
Tween 20: 10 mL per liter (~38 mL per gallon)
Tween 80: 10 mL per liter (~38 mL per gallon)
Fill with clean water to reach 1 L (or 1 gal).
Mix for at least 30 minutes, ensure it is uniform. Always mix well before use. This is the concentrate: 20% soybean oil, 20% corn oil, 1% Tween 20, 1% Tween 80.
Step 2. Dilute for spraying
For foliar application:
Dilution rate: Add ~20mL of concentrate per liter of water (~75 mL per US gallon of water). If pests are present you can increase the rate up to 32mL/L (~120mL/gal).
Note on coverage: Coverage is critical for this spray to work as it only kills insects on contact or prevents PM by building an oil film on the leaf that prevents spore germination. Without full coverage effectiveness will drop.
This produces a 0.8% oil spray with 0.02% Tween 20 and 0.02% Tween 80 in the final spray solution. Mix well before use.
Shelf life considerations
Concentrate: A freshly prepared concentrate can stay stable for several weeks if kept sealed, cool, and out of light. Always shake well before use, since some slow separation can occur.
Diluted spray: Once mixed with water, use the spray the same day. Emulsions can separate within 12-24 hours, and microbial growth in water can destabilize the mix. Discard leftovers rather than storing diluted spray.
Indicators of instability: Layering, large oil droplets, or visible separation mean the emulsion is breaking, don’t spray that on plants without mixing well again.
Why it works
Soybean oil sprays at 2% suppressed powdery mildew on roses and tomatoes (1), reduced spider mites by 97-99% (2), and deterred whiteflies (3). Corn oil added control of cucumber mildews (5). Tweens stabilize and spread the oils (4).
Bottom line
Concentrate: 200 mL soybean oil + 200 mL corn oil + 10 mL Tween 20 + 10 mL Tween 80 per liter (or 760 mL + 760 mL + 38 mL + 38 mL per gallon), topped up with water.
Spray dilution: 75 mL concentrate per gallon of water.
Final spray: 0.8% oil, 0.02% Tween 20, 0.02% Tween 80.
Shelf life: Weeks for concentrate (if stored sealed, cool, dark); hours for diluted spray.
This blended, dual-Tween foliar spray is a low-cost, evidence-backed way to add an oil-based control into hydroponic IPM programs.
Recent advances in hydroponic cucumber cultivation: media, irrigation, nutrition and biostimulants
Cucumber has become a model crop for testing new soilless technologies, with greenhouses adopting alternative substrates, precision fertigation and biostimulants. Over the last decade a series of peer-reviewed studies have clarified what actually shifts growth and yield, and what is still more hype than practice.
A soilless cucumber greenhouse using coco coir.
Substrate choices: coir, waste materials and microbiome effects
The clearest advance is the repeated demonstration that coconut coir outperforms rockwool in cucumbers. A 2022 Heliyon study reported higher leaf area index, greater yields and increased mineral content (Ca, Mg, S, Cl, Zn) in coir compared with rockwool, alongside shifts in fruit amino acids and flavor compounds (1). This is not marginal, it reflects both physiology and quality.
Efforts to cut peat use are also accelerating. A 2025 Scientific Reports trial tested agricultural wastes such as cocopeat, palm peat, vermicompost, sawdust and pumice, finding several blends that produced transplant vigor comparable to peat moss (2). Another study replaced cocopeat with rice straw, sawdust and compost over two seasons; rice straw and coir-rice blends gave the best irrigation water productivity and photosynthesis with yields close to cocopeat (3). In parallel, wood fiber has been tested in combination with peat under staged nitrogen inputs, showing that fiber proportion and N rate jointly determine nutrient uptake efficiency (4).
Beyond performance metrics, substrate strongly shapes the cucumber root microbiome. A 2022 Frontiers in Microbiology study showed that different artificial substrates led to distinct bacterial community structures and predicted functions in roots, highlighting that choice of media can influence not only plant nutrition but also microbial dynamics (6).
Finally, biochar-compost amendments are emerging as candidate peat replacements. A 2023 trial demonstrated improved cucumber seedling growth with certain biochar-compost mixes, though physical properties still dictated success (5).
Takeaway: Coir is a proven upgrade over rockwool. Waste-based and fiber blends can substitute part of peat if their hydrophysical traits are tuned. Substrates also rewire root microbiomes, adding another layer to consider.
Irrigation and fertigation: oxygenation and nutrient recipes
Irrigation research has focused on dissolved oxygen. A 2023 Scientific Reports paper tested micro-nano bubble irrigation: raising water DO from ~4 to 9 mg·L⁻¹ increased yield and irrigation water use efficiency by ~22%, while boosting vitamin C, soluble solids and photosynthesis (7). The effect is practical, low oxygen is common in dense cucumber crops under low light.
On the nutrient side, hydroponics consistently outperforms soil. A 2025 Scientific Reports comparison found cucumbers in Hoagland solution under soilless culture had taller plants, more flowers and nodes, and 9-19% more fruits than soil-grown controls on alternative formulations (8). These are large differences that underscore the importance of using a complete, balanced solution and not cutting corners on formulation.
Takeaway: Boosting dissolved oxygen is a low-cost irrigation improvement. And nutrient recipes matter, generic soil formulas do not translate well to hydroponics, where Hoagland-type solutions remain robust.
Nutrient interactions: silicon and iron
Element interactions are less visible but no less important. A 2020 Frontiers in Plant Science study showed that supplying silicon in hydroponics triggered iron deficiency responses in cucumber, even under adequate Fe, and altered recovery after resupply (9). This is a reminder that “beneficial” elements are not always benign and should be managed carefully, especially when layering biostimulants or micronutrient supplements.
Biostimulants and stress management
Humic substances remain the most tested tools. A 2024 Scientific Reports study under 10 dS·m⁻¹ NaCl found that foliar humic acid sprays, especially when combined with grafting onto tolerant rootstocks, improved cucumber growth, antioxidant activity and secondary metabolism relative to untreated controls (10). This reinforces humics as a stress-mitigation option rather than a universal growth booster.
Microalgae are also being trialed. A 2023 MDPI study using Chlorella vulgaris suspensions increased root dry biomass of cucumber seedlings in hydroponic culture (11). The shoot response was more variable, but the root effect suggests promise for early growth stages.
Grafting remains a practical biostimulant in the broad sense. A 2023 Environmental Pollution study showed that salt-tolerant rootstocks reduced Na transport into cucumber shoots, improving yield and fruit quality under salinity (12).
Takeaway: Humic acids and grafting can buffer salinity stress, while microalgae show root growth potential. None of these replace proper fertigation, but they add resilience once fundamentals are stable.
Practical synthesis
Switch to coir if you are still on rockwool. Yield and mineral improvements are consistent (1).
Trial waste substrates cautiously. Rice straw and fiber blends can work, but only when physical properties are controlled (2)(3).
Oxygenate irrigation water. in NFT systems Aiming for ~9 mg·L⁻¹ DO has measurable payoffs in yield and quality (7).
Use complete nutrient recipes. Hoagland still outperforms incomplete alternatives (8).
Watch element interactions. Silicon can complicate iron nutrition in hydroponics (9).
Layer biostimulants for stress, not yield. Humic acids, grafting and microalgae add tolerance or early root vigor but only after fertigation and media are optimized (10)(11)(12).