Comparing Nutrient Solutions for Hydroponic Strawberry Production
Getting the right nutrient solution for strawberries in hydroponics can feel like trying to solve a puzzle where every piece matters. Unlike many crops where you can get away with a generic formula, strawberries are particularly responsive to nutrient composition, especially when it comes to the balance between nitrogen and potassium. Today, we will explore how different nutrient formulations affect both yield and fruit quality in soilless strawberry production.
The Modified Steiner Approach
When researchers at the Technological Institute of Torreón tested different nitrogen and potassium combinations in strawberries, they discovered something important about how these two nutrients interact. Using a (1) modified version of Steiner’s Universal Nutrient Solution, they evaluated twelve different formulations with nitrogen ranging from 126 to 210 ppm and potassium from 195 to 430 ppm.
The results were revealing. Plants receiving 168 ppm nitrogen combined with 430 ppm potassium achieved yields of 114 grams per plant, which was significantly higher than lower nitrogen treatments. However, here is where it gets interesting: while high nitrogen boosted yield, it actually decreased fruit quality. The highest soluble solids content (10.5 degrees Brix) occurred at the lowest nitrogen level of 126 ppm. This creates a real dilemma for growers who want both high yields and premium quality fruit.
| Solution Type | N (ppm) | P (ppm) | K (ppm) | Ca (ppm) | Mg (ppm) | Yield | Quality Impact |
|---|---|---|---|---|---|---|---|
| Modified Steiner (Low N) | 126 | 46 | 195 | 449 | 121 | 89.3 g/plant | Highest Brix (10.5°) |
| Modified Steiner (Medium N) | 168 | 32 | 273 | 360 | 97 | 108 g/plant | Moderate Brix (10.0°) |
| Modified Steiner (High N) | 210 | 19 | 194 | 413 | 111 | 111 g/plant | Lowest Brix (9.5°) |
The Critical Role of Potassium
What emerged from this study was potassium’s profound impact on fruit quality. When potassium was increased to 430 ppm, the soluble solids climbed to 10.6 degrees Brix, and phenolic compounds reached their peak as well. The (1) research showed that the optimal combination for maximizing both yield and nutraceutical quality was 168 ppm nitrogen with 430 ppm potassium, resulting in antioxidant capacity of 6305 microequivalents of Trolox per 100 grams.
This makes physiological sense. Potassium plays a fundamental role in sugar transport through the phloem, and when potassium availability is adequate, more sugars accumulate in the fruit. Meanwhile, excessive nitrogen tends to promote vegetative growth and the synthesis of nitrogen containing compounds like proteins and amino acids, rather than the accumulation of secondary metabolites that contribute to fruit quality.
Optimizing NPK Ratios for Chinese Greenhouses
A comprehensive study from China Agricultural University took a different approach by examining the combined effects of nitrogen, phosphorus, potassium, and water on strawberry production. Using a (2) quadratic regression design with 36 treatments, researchers determined that nitrogen was by far the most important factor, followed by water, then phosphorus, with potassium having the least impact on the sweetness to acidity ratio.
Their optimal formulation for achieving yields above 110 grams per plant with excellent fruit quality included nitrogen at 156 to 172 ppm (supplied as calcium nitrate), phosphorus at 54 to 63 ppm (as sodium dihydrogen phosphate), and potassium at 484 to 543 ppm (from potassium sulfate). This represents significantly higher potassium levels than the Steiner based formulations, suggesting that when other nutrients are optimally balanced, strawberries can benefit from even more potassium.
| Nutrient | Optimal Range (ppm) | Impact on Yield | Impact on Quality (SSC/TA) |
|---|---|---|---|
| Nitrogen (N) | 156 to 172 | Most significant positive effect | Most significant factor |
| Phosphorus (P) | 54 to 63 | Moderate positive effect | Second most important |
| Potassium (K) | 484 to 543 | Significant positive effect | Minimal impact |
| Water | 12.0 to 13.1 L/plant | Second most important | Third most important |
The Calcium and Electrical Conductivity Question
While much attention focuses on NPK ratios, calcium concentration matters enormously in strawberry production. In the modified Steiner solutions, calcium ranged from (1) 244 to 449 ppm depending on the treatment. Higher calcium levels corresponded with lower nitrogen and potassium concentrations, maintaining appropriate osmotic potential.
Research has shown that the electrical conductivity (EC) of the nutrient solution significantly impacts strawberry performance in soilless culture. Studies using different EC levels found that (3) 1.3 mS/cm was optimal for spring production, while 2.2 mS/cm proved better during winter months. This seasonal adjustment reflects the plant’s changing water use and nutrient demand patterns throughout the growing cycle.
Micronutrient Considerations
While macronutrients get most of the attention, micronutrient composition matters too. The (1) modified Steiner formulations included iron at 5 ppm, manganese at 1.6 ppm, boron at 0.865 ppm, zinc at 0.023 ppm, copper at 0.11 ppm, and molybdenum at 0.048 ppm. These concentrations remained constant across all treatments, suggesting that within reasonable limits, macronutrient balance has a more pronounced effect on yield and quality than micronutrient variation.
Making Practical Choices
So what should you actually do with this information? If you are growing strawberries hydroponically and want to maximize both yield and quality, consider starting with a solution containing approximately 160 to 170 ppm nitrogen, 55 to 60 ppm phosphorus, and 400 to 500 ppm potassium. Maintain the K:Ca ratio near 1-1.4:1 and the K:Mg ratio near 4:1. This matches some of my previous publications on the K:Ca ratio.
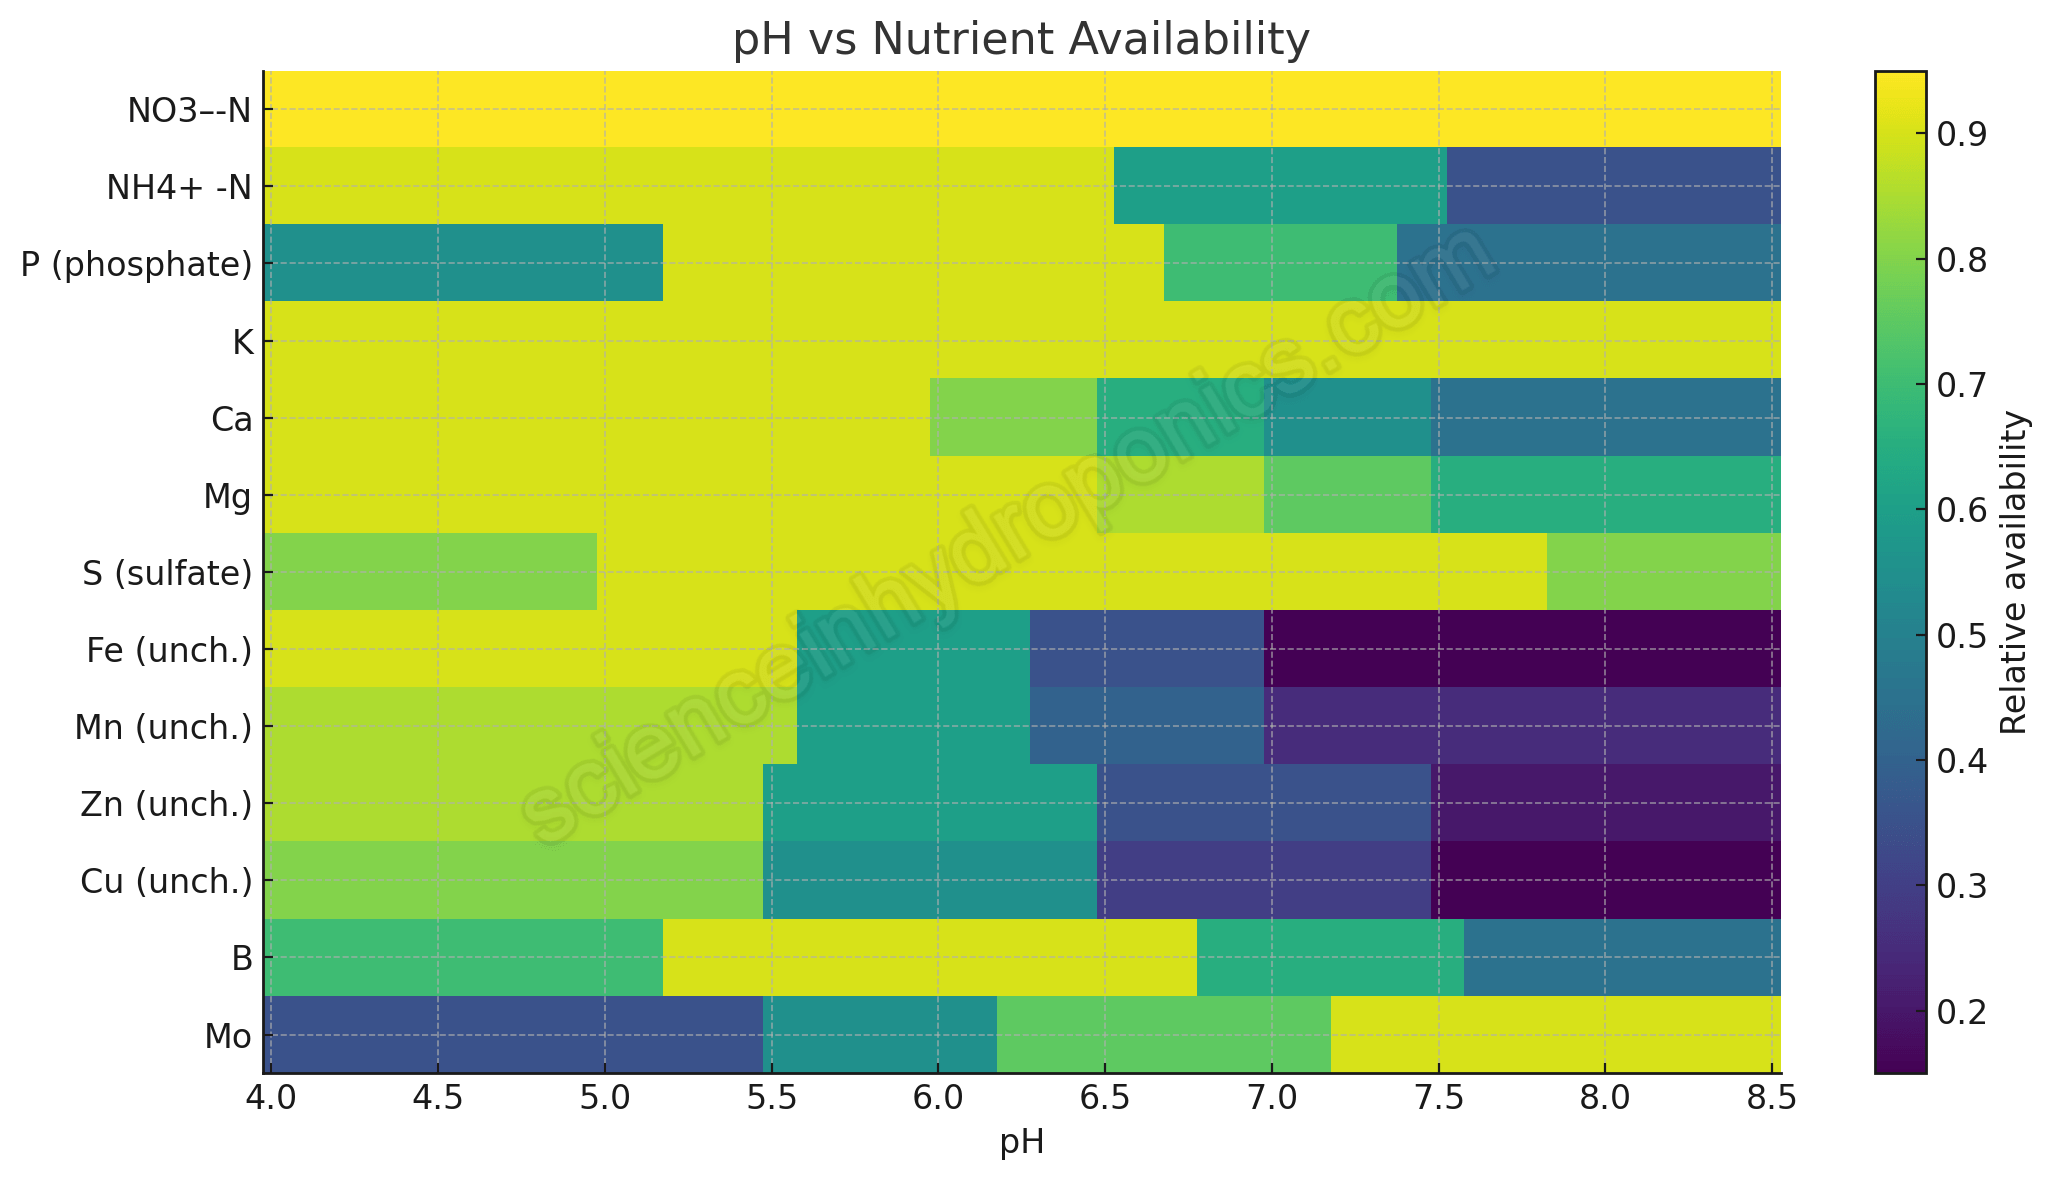
Remember that these recommendations assume you are maintaining appropriate pH (around 5.5 to 6.0) and EC levels suitable for your growing conditions. The (2) research demonstrated that excessive nutrients actually decreased both yield and quality, so more is definitely not better. You will need to adjust based on your specific cultivar, climate, and growing system, but these ranges provide a solid starting point backed by peer reviewed research.
The key takeaway is that strawberry nutrition in hydroponics requires a delicate balance. While nitrogen drives yield, potassium enhances quality, and the interaction between these two nutrients determines your ultimate success. Monitor your plants carefully, conduct tissue analysis when possible, and do not be afraid to adjust your formulation based on what the plants are telling you.