New tissue analysis feature in HydroBuddy v1.99
Tissue Analysis
To grow great plants, we need to grow plants that have a healthy mineral composition. Although there are no theoretically established values for what the mineral composition of a plant should look like, we have grown healthy plants and have established, through analysis of their tissue, what this mineral composition should empirically be. By sampling the leaf tissue from your plants and sending it to a lab for analysis, you can know what the composition of your tissue is and how it compares to healthy plants grown by others.
The question is, can we create a nutrient formulation just from the tissue composition we want to get?
Nutrient solution targets from tissue analysis
Turns out, you can figure out the elemental concentrations that are required in solution to get to certain concentrations in tissue. My colleague and friend – Bruce Bugbee – proposed in this paper about nutrient management in 2004 how this could be done. To achieve this, we make the assumption that all elements taken up by the plant will be deposited as minerals upon transpiration – because minerals cannot leave the plant as gases – so knowing the amount of water that will transpired per amount of tissue grown, we can figure out how much of that element needs to be in the water.
The volume of water required to grow a certain mass of tissue is called Water Use Efficiency (WUE). It is expressed as gram of tissue per liter of water transpired and has values from 3.0 to 6.0. Higher WUE values imply the plant is growing more efficiently, requires less water to grow the same mass of tissue, while a lower WUE implies the plant is less efficient and needs to transpire more to grow. Conditions that increase growing efficiency and decrease transpiration, such as carbon dioxide enrichment and high humidity, tend to increase WUE, while conditions that create inefficient growing – like low humidity with high temperature – tend to decrease it.
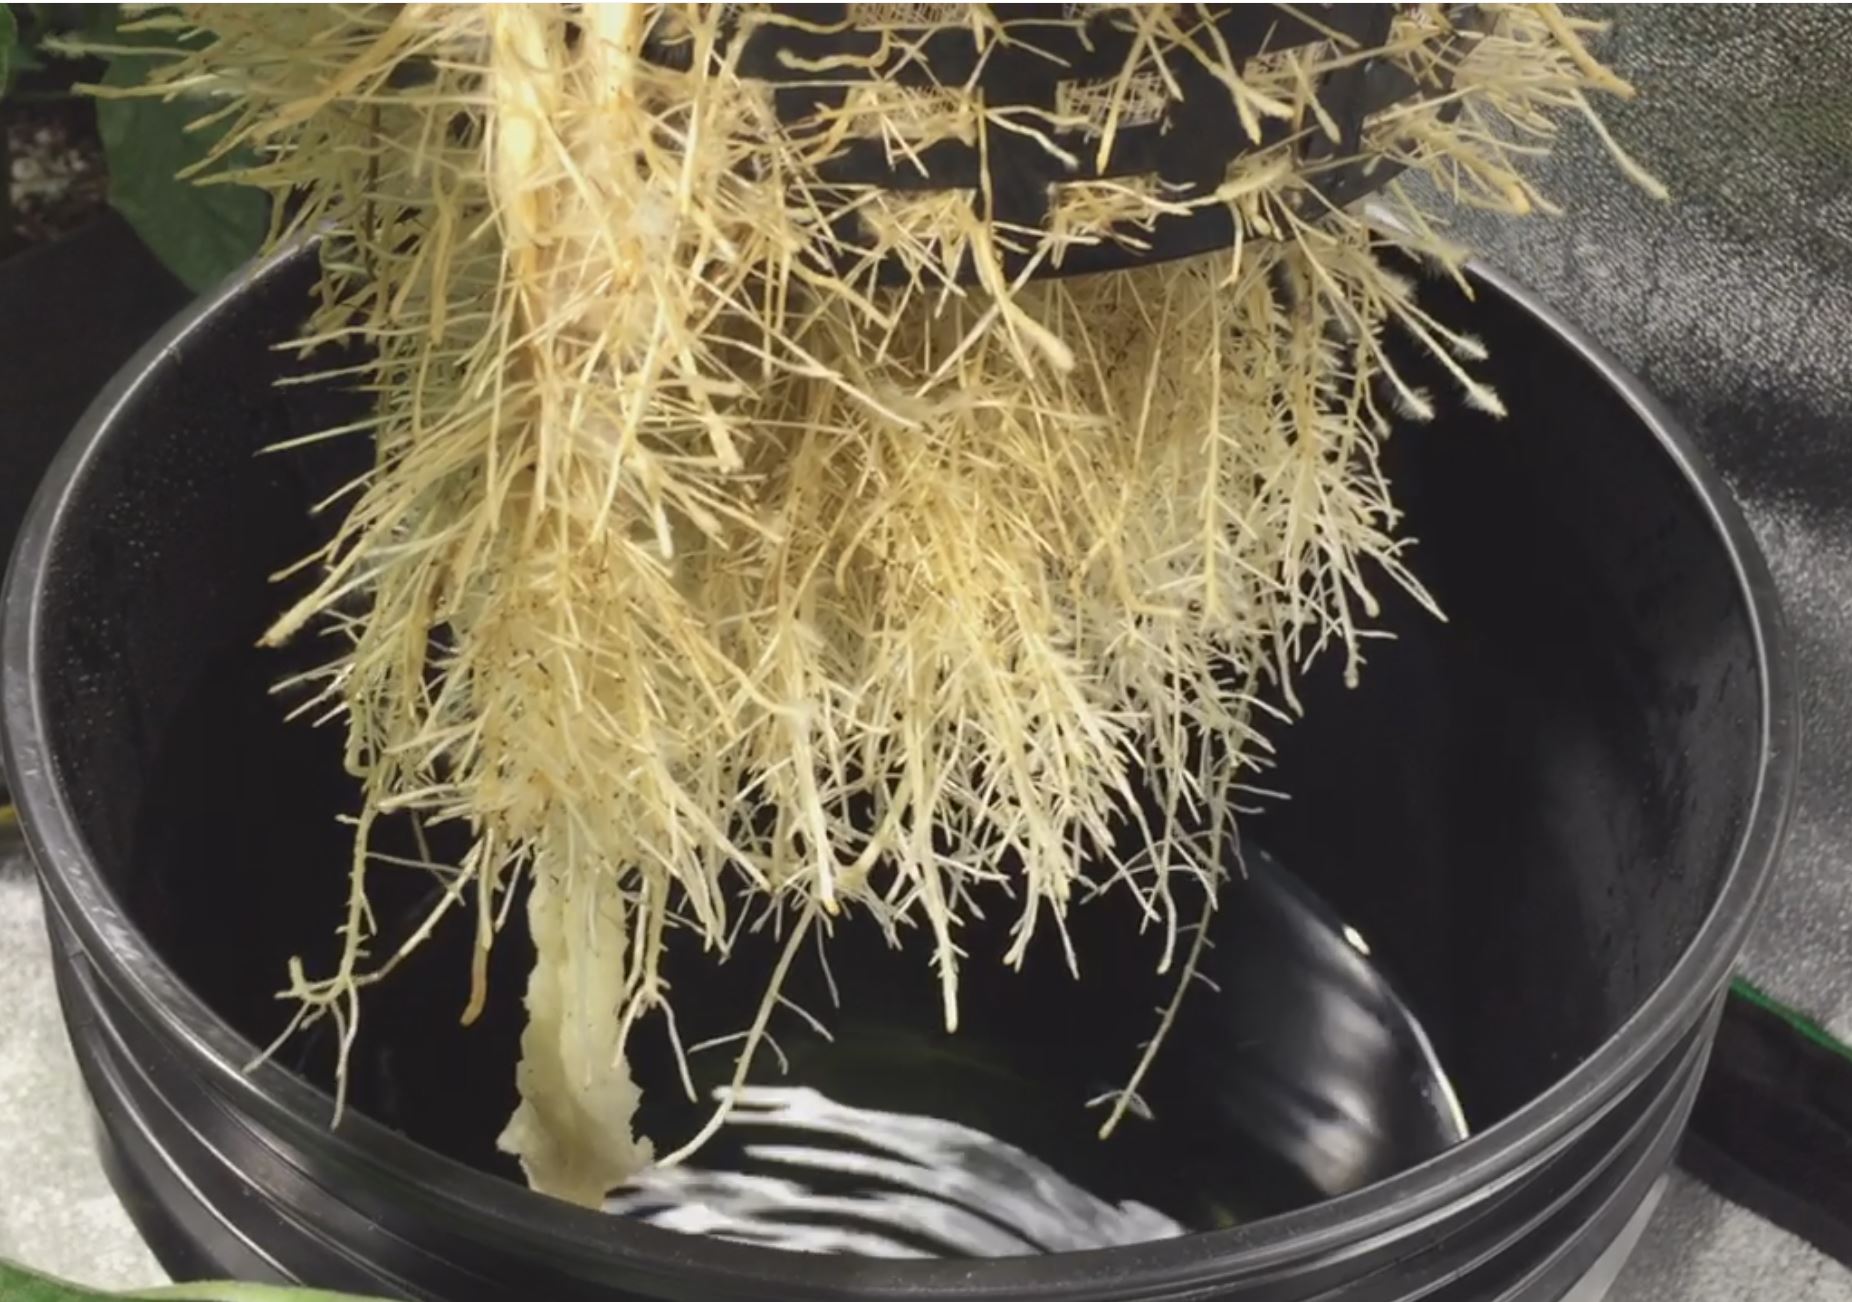
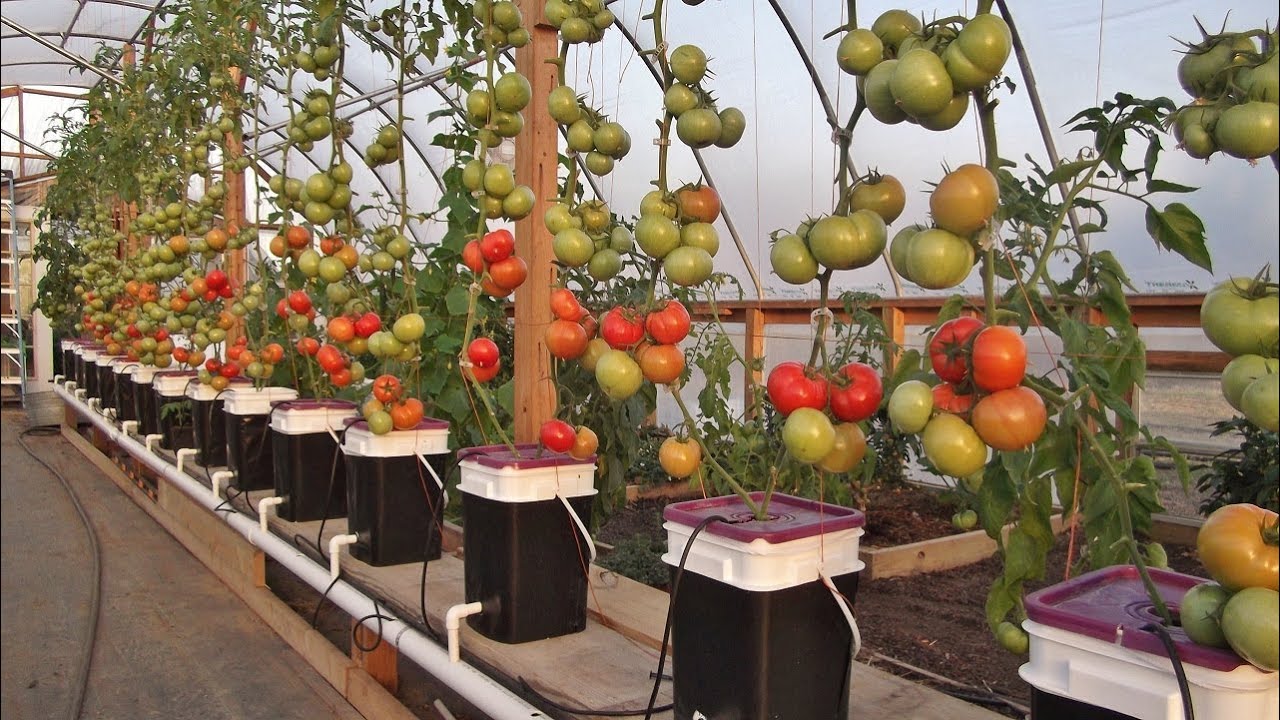
If we grow plants with a solution where we determine the nutrients according to the WUE and the concentrations in tissue we want, we can create very effective solutions that lower the probability of over accumulation of nutrients in the root zone and the solution. This allows for solutions that require no dumping and create very healthy plants in recirculating systems (for which Deep Water Culture, DWC, is the most common example).
Doing this process in HydroBuddy
From v1.99, HydroBuddy now includes a “Tissue Analysis” dialogue that allows you to use target tissue concentrations and a certain WUE value, to figure out what the required nutrient concentrations in a hydroponic solution would be like. The program also includes a small Database with tissue targets for certain plants and certain stages of development. There are also a couple of links that point you to resources where you can find a wide variety of different plant species and development stages if the ones that interest you are not included in the software’s default DB configuration.
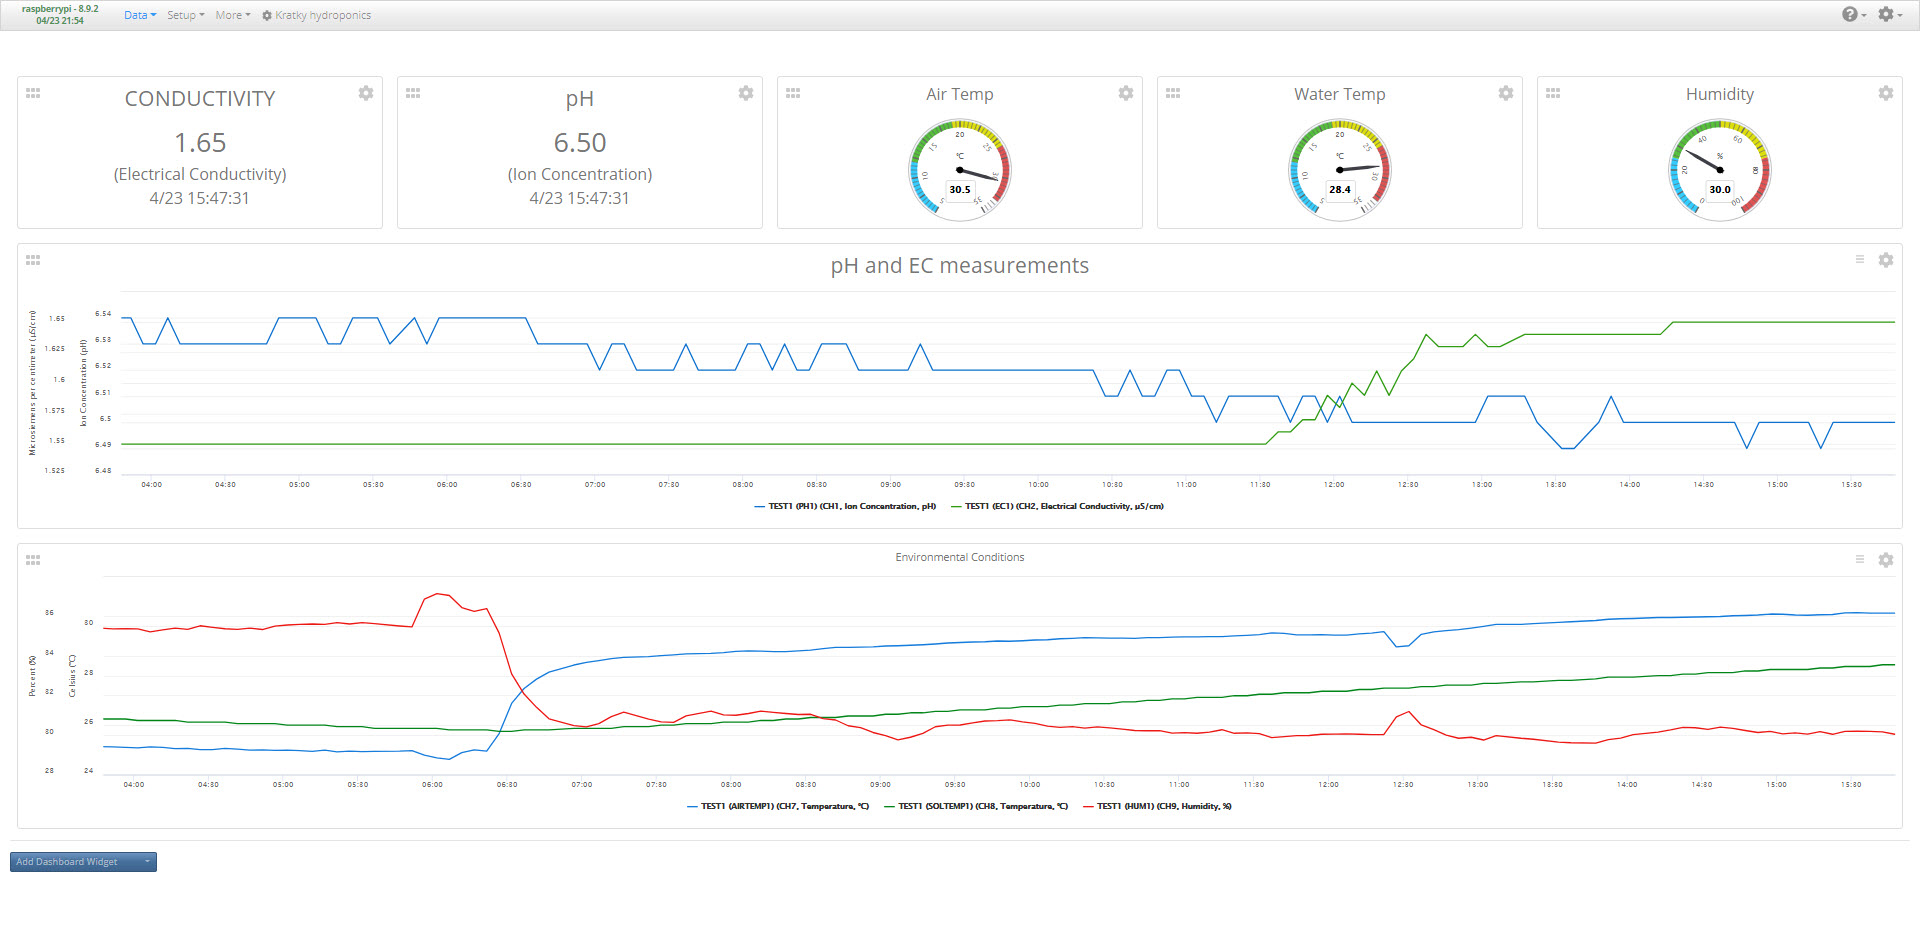
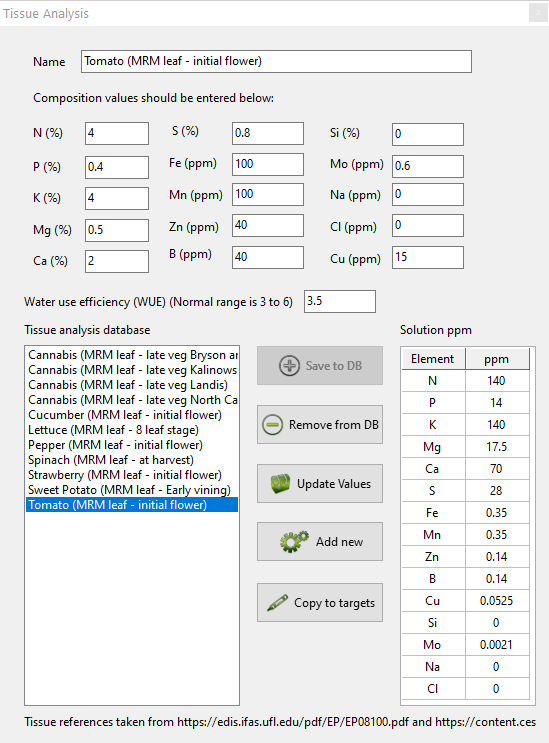
The image below shows you an example where I determined the target solution concentrations required to grow a tomato plant that has the composition expected for a tomato plant in early flower.
How do I figure out the WUE?
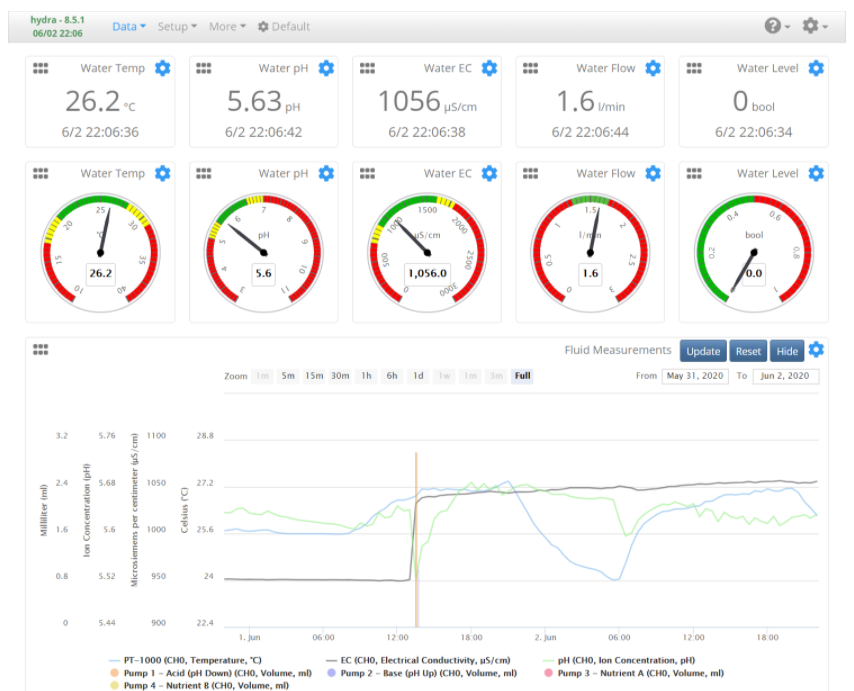
As you can see, the above process requires you to input the WUE. This ranges from 3 to 6. It is not easy to measure in the environment, so the best practical solution is to assume your WUE is about 3.5 (the default value), prepare solutions with those concentrations and then observe how the EC of the solution changes as a function of time.
A solution that is prepared with a concentration that would be appropriate for the exact WUE of the plants will have an initial decrease in EC – as nutrients that are taken actively are rapidly taken up – followed by more stable to slightly decreasing EC conditions as uptake changes to be mostly passive. This cycle is repeated when solution is replenished to recover the initial volume in a recirculating system. A solution that is prepared too concentrated will have an increasing EC while a solution that is prepared too diluted will show a consistently decreasing EC. If your EC decreases more sharply with time then you need to assume a higher WUE, if your EC increases then you need to lower your WUE assumption.
Limits of the approach
While this approach can be very useful to create long lasting solutions, especially in recirculating systems, it suffers from some important limitations.
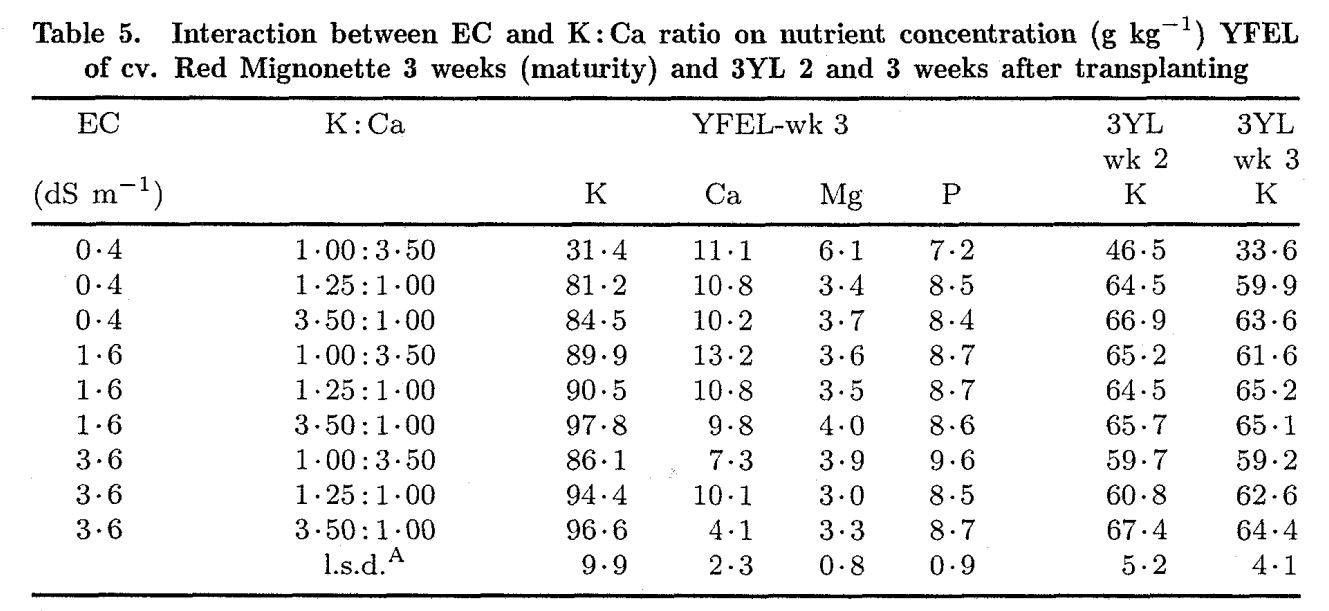
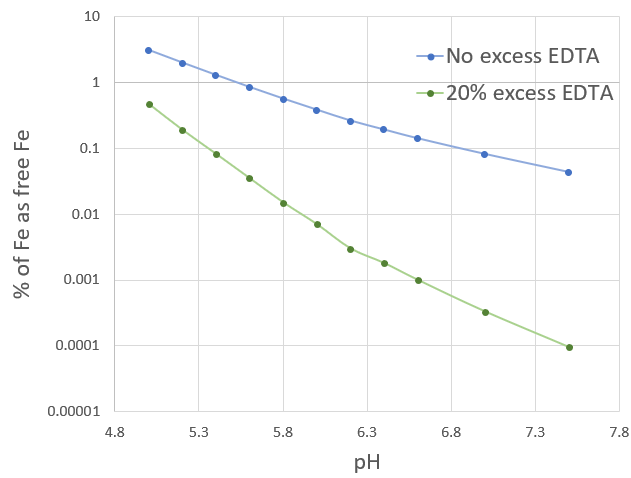
The first is that it doesn’t account for changes in uptake due to changes in pH or availability in solution. This is the reason why the recommendations for elements like Fe and Mn, might be significantly lower than what you commonly see in nutrient solutions. In the above example, the solution requires only around 0.35ppm of Fe, but this means we need 0.35ppm of fully available Fe for the plant, which in reality might mean having 1.5ppm of Fe or more of added Fe, depending on the chemical form of Fe and the pH of the solution.
The above implies that values should not be used without considering the context and that this context might be much more important for some nutrients, for example micro nutrients, than for other elements, for example K and Ca, for which the availability windows and plant uptake are much more straightforward. The plant characteristics should also be taken into account. While a leaf tissue derived approach might only require 50 ppm of Ca in a lettuce crop, we know we need to feed more due to the poor water transport of this plant into new leaves.
Second, the approach assumes that all we care about is leaf composition. This is a perfectly fine if we are growing leafy greens, but if you’re growing a tomato plant, the composition will be heavily split between leaves and fruits as soon as flower pollination ends. For this reason, the nutritional needs of other important tissues – such as sink organs – should be considered very carefully when following this approach. In the case of tomatoes, this might mean feeding substantially higher levels of K, as this element has a much higher concentration in fruits than it has in leaves.
Crops that have changing nutritional needs due to changes in the composition of the tissue formed, require different nutrient solutions as a function of time, as we need to match the overall expected composition of the entire plant, not just the leaves.
Conclusions
Nutrient formulations do not need to be just trial and error. Up until now, besides a formulation database, HydroBuddy had no feature to help growers create formulations with any scientific basis. This new feature, introduces the ability to use target leaf tissue composition and WUE as a way to guide the initial formulation of nutrient solutions. While you still need experience to figure out when to overrule these values and increase or decrease concentrations, it does provide basic blue prints to build from. An analysis of how a formulation derived from tissue compares with your current formulation might also give you some insights into whether you are over or under feeding any elements.
Have you use the HydroBuddy’s leaf tissue analysis feature? Leave us some comments below!