Six things to look for in a Hydroponic sensor data logging system

Data is key. It will help you obtain high yields and improve with each additional crop cycle. Having sensor measurements not only allows you to diagnose your crop at any given point in time but also allows you to go back and figure out what might have happened if something went wrong. With all the commercial offerings now becoming available, it is starting to become harder and harder to evaluate which data logging system might be ideal for you. In this post, I seek to share with you 5 things that I always look for when evaluating data logging systems for a greenhouse or grow room. These are all things that will enable you to store sensor data adequately and take full advantage of it, ensuring you’re not handy capped by a poor starting choice.

Sensor compatibility. One of the first things that I look for is which sensors I can add and what restrictions I might have on sensors that are added to the system. I like to have systems where I can connect any 3-5V analog sensor I want. I also want to be able to connect sensors that use common protocols, like i2c sensors. I also like to know that for things like pH and EC, the boards have standard plugs I can connect to, to make sure I can replace the electrodes given to me by the company with others if I wish to do so. Freedom in sensor compatibility and in the ability to replace sensors with sensors from outside the company are both a must for me.

Expandability. Many of the commercially available data logging platforms are very restricted and can often only accommodate a very small number of sensors. Whenever you’re looking for a data logging solution that will need to be deployed on a medium/large scale, it is important to consider how this implementation can expand, and how painful it would be to make that expansion. Being able to easily add/remove sensors to a platform is key to having a flexible and robust data logging solution.

Wikimedia Commons

Not cloud reliant. It is very important for me to be able to use the system, regardless of whether the computers are online or not, and to have all the data that I register logged locally in some manner. Systems where an internet connection is needed for data logging or where data is not stored locally are both big show stoppers when it comes to evaluating a data logging system. There is nothing wrong with having data backed up to the cloud – this is indeed very desirable – but I want to ensure that I have a local copy of my data that can I always rely on and that logging of data won’t be stopped because there is some internet connection issue. Also bear in mind that if your sensors are cloud reliant you will be left without any sort of data logging system if the company goes under and those servers cease to exist.

Connectivity of sensors is robust. In many of the more trendier new systems sensor connectivity is wireless. This can be perfectly fine if it is built robustly enough, but it is often the case that connections based on WiFi will tend to fail under environments that are filled with electromagnetic noise, such as when you have a lot of HPS ballasts. It is therefore important to consider that if you have such an environment, having most of your sensors connected using cables, or using a wireless implementation robust to this type of noise is necessary.

Have a robust API to directly access your data. Since I do a lot of data analyses using the data from hydroponics crops, I find it very crippling to be limited by some web interface that only allows me to look at data in some very limited ways. I want any data logging system I use to allow me to use an API to get direct access to the data so that I can implement a data structure and analysis the way I see fit. Having your data available through a robust API will allow you to expand the usage of your data significantly and it will also ensure you can backup your data or structure the database in whatever way you see fit. An example of this is sensor calibration logging and comparisons, while commercial platforms almost never have this functionality, having an API allows me to download the data and compare sensor readings between each other to figure out if some sensors have lost calibration or make sure to schedule their calibration if they haven’t been calibrated for a long time.

Ability to repair. When making a data logging choice, we are making a bet on a particular company to continue existing and supporting their products in the long term. However, this is often not the case and we do not want to be left with a completely obsolete system if a company goes under and ceases to support the product they made. I always like to ensure that the systems that are being bought can continue working if the company goes under and that there is a realistic ability to find parts and replace sections of those products that might fail in the future if this were to be the case. Open source products are the most ideal because of this fact.

These are some of my top six priorities whenever I evaluate a commercial data logging solution for deployment. From the above, not being cloud reliant and having a robust API are the most important, while sensor compatibility can be ignored to an extent if the system is only being deployed for a very specific need (for which the sensors provided/available are just fine). Which of the above you give the most priority to depends on how much money you’re going to be investing and how big and robust you want the implementation to be.

Differences between labels and actual composition values in commercial hydroponic fertilizers

Whenever I am hired to duplicate a company’s fertilizer regime based on commercial products, I always emphasize that I cannot use the labels of the products as a reference because of how misleading these labels can be. A fertilizer company only needs to tell you the minimum amount of each element it guarantees there is in the product, but it does not have to tell you the exact amount. For example, a company might tell you their fertilizer is 2% N, while it is in reality 3%. If you tried to reproduce the formulation by what’s on the label you would end up with substantially less N, which would make your mix perform very differently. This is why lab analysis of the actual bottles is necessary to determine what needs to be done to reproduce the formulations.

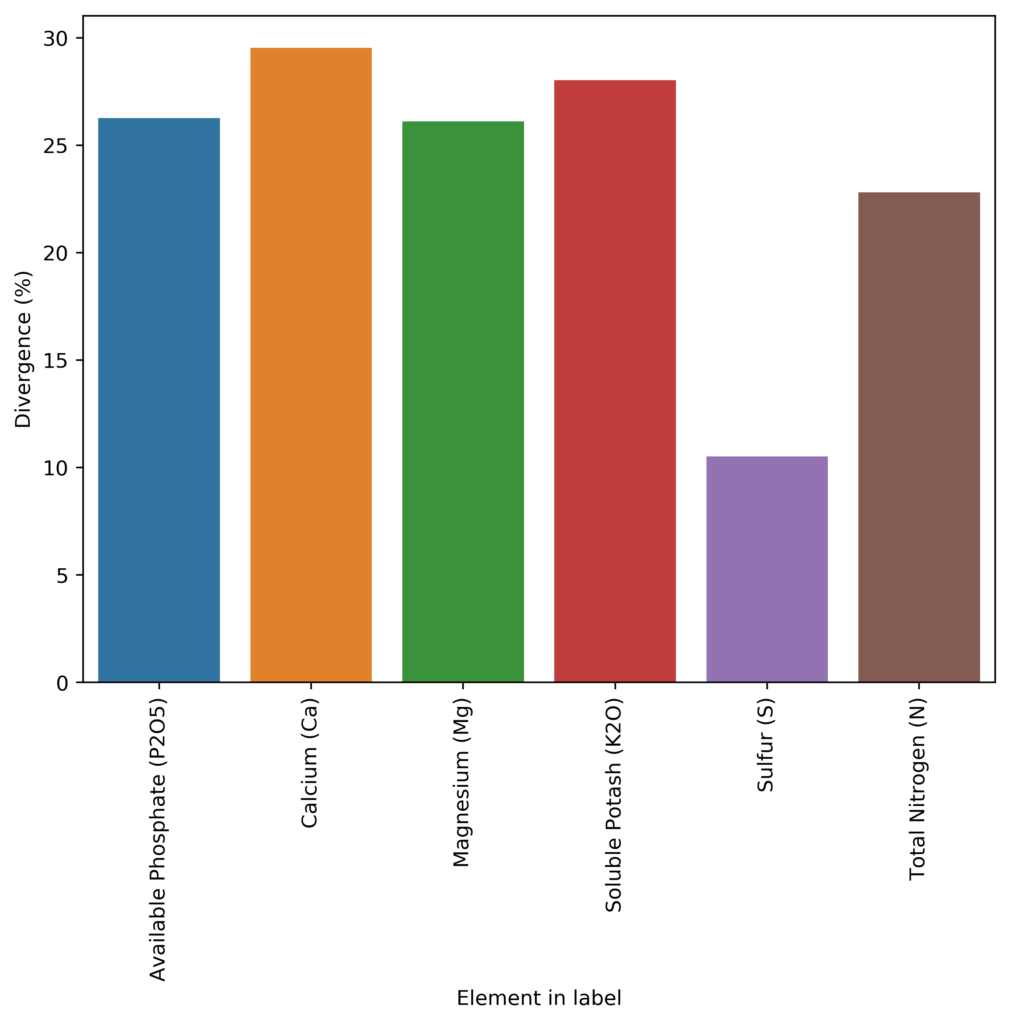
Average deviation from the reported composition on the label compared with lab analysis.

How bad is this problem though? Are companies just under-reporting by 1-5% in order to ensure they are always compliant with the minimum guaranteed amount accounting for manufacturing errors or are they underreporting substantially in order to ensure all reverse engineering attempts based on the labels fail miserably? I have a lot of information about this from my experience with customers – which is why I know the problem is pretty bad – but I am not able to publicly share any of it, as these lab tests are under non-disclosure agreements with them. However, I recently found a website from the Oregon government (see here), where they share all the chemical analysis of fertilizers they have done in the past as well as whatever is claimed on labels.

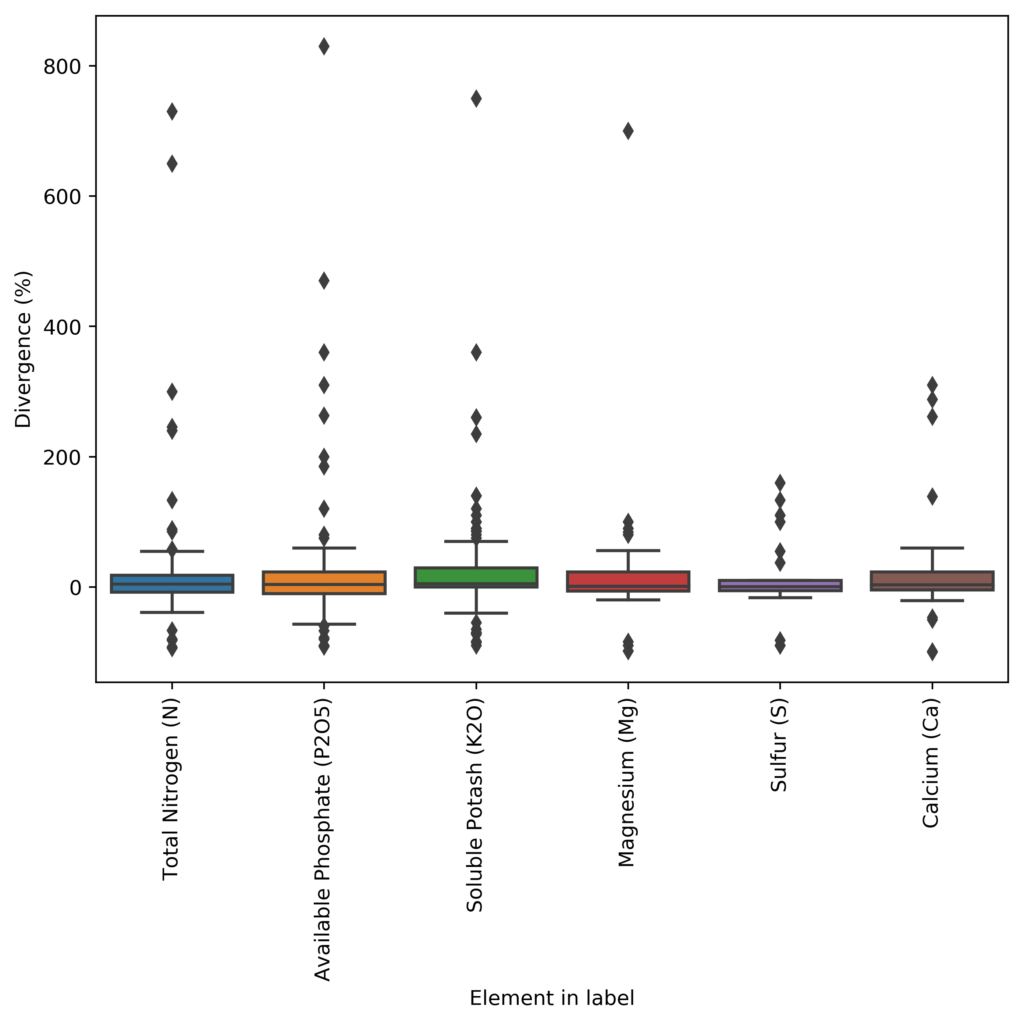
The Oregon database is available in pdf form, reason why I had to develop a couple of custom programming tools to process all the information and put it into a readable database. So far I have only processed the fertilizers that were registered in 2015, but I am going to process all the fertilizers available in their database up until 2018 (the last year when this report was uploaded). However, you can already see patterns emerging for just the 2015 data. That year there were 245 fertilizers tested, from which 213 contained N, P, K, Ca, S or Mg. If we compare the lab results for these elements with the results from the lab analysis, we can calculate the average deviation for them, which you can see above. As you can see, companies will include, on average, 20%+ of what the labels say they contain. This is way more of a deviation than what you would expect to cover manufacturing variations (which are expected to be <10% in a well-designed process) so this is definitely an effort to prevent reverse engineering.

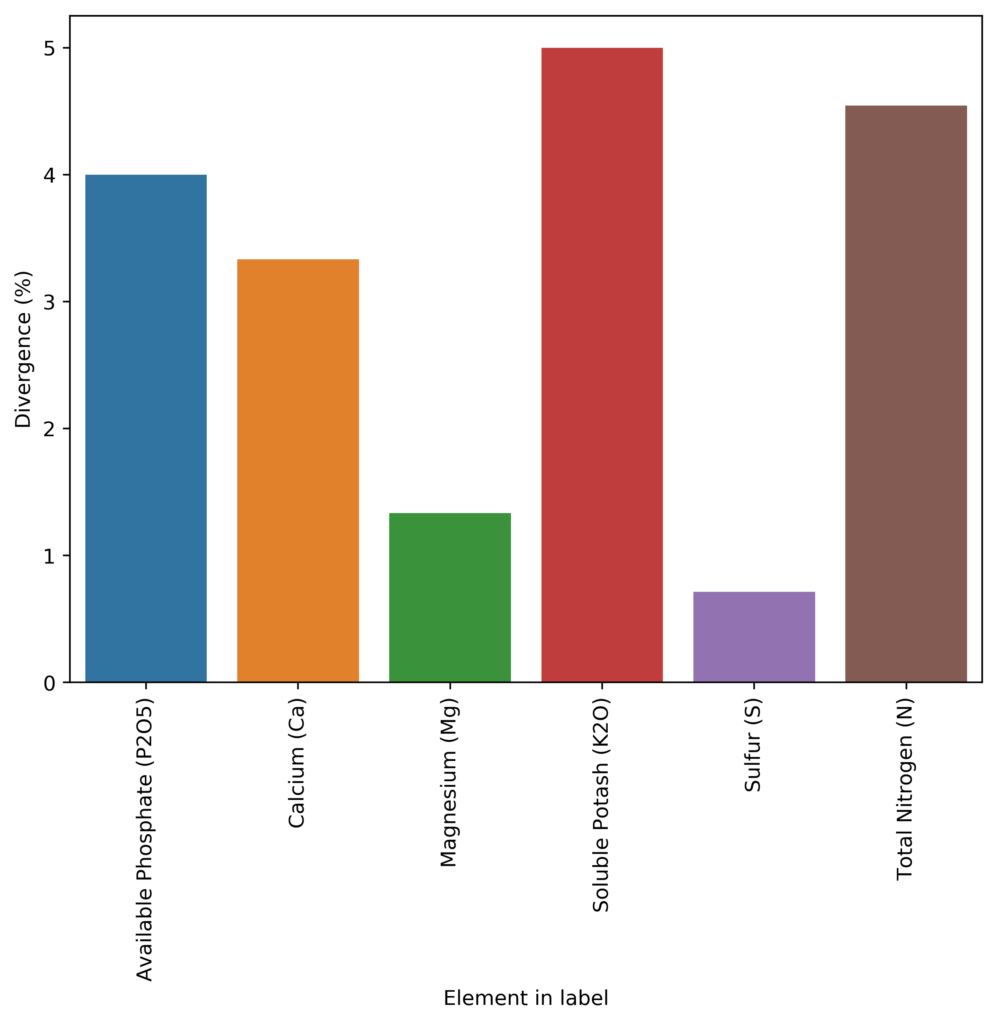
Median divergence between compositions derived from labels and lab analyses.
Boxplot of the divergences between compositions derived from labels and lab analyses.

Furthermore, the deviations are by no means homogeneous in the database. The above graphs showing the box plot and median deviation values, show us that most people will actually be deviated by less than 5% from their label requirements, but others will be very largely deviated, with errors that can be in the 100%+ deviation from their reported concentration. In many cases, companies also have negative deviations, which implies that the variance of their manufacturing process was either unaccounted for or there was a big issue in the manufacturing process (for example they forgot to add the chemical containing the element). These people would be in violation of the guaranteed analysis rules and would be fined and their product registrations could be removed.

With this information, we can say that most people try to report things within what would be considered reasonable if the label is to remain accurate (deviations in the 1-5% range) to account for their manufacturing issues but many companies will choose to drift heavily for this and report values that are completely misleading relative to the labels. These companies are often the ones that are most widely used as they are the ones who want to protect themselves from reverse engineering most aggressively.

Take for example General Hydroponics (GH). Their FloraGro product is registered with an available phosphate of 1%, while the actual value in the product is 1.3%, this is a 30% deviation, far above the median of the industry. They will also not just underreport everything by the same amount – because then your formulation would perfectly match when you matched their target EC – but they will heavily underreport some elements and be accurate for others. In this same Floragro product, the K2O is labeled as 6% and the lab analysis is 5.9%, meaning that they reported the value of K pretty accurately. However, by underreporting some but not others, they guarantee that you will skew your elemental ratios by a big margin if you try to reverse engineer the label, which will make your nutrients work very differently compared to their bottles.

As you can see, you just cannot trust fertilizer labels. Although most of the smaller companies will seek to provide accurate labels within what is possible due to manufacturing differences, big companies will often engineer their reporting to make it as hard as possible for reverse engineering of the labels to be an effective tactic to copy them. If you want to ever copy a commercial nutrient formulation, make sure you perform a lab analysis so that you know what you will be copying and never, ever, rely solely on the labels. I will continue working on this dataset, adding the remaining fertilizers, and I will expand my analyses to include micronutrients, which are covered by Oregon government tests.


Nutrient availability and pH: Are those charts really accurate?

When growing plants, either in soil or hydroponically, we are interested in giving them the best possible conditions for nutrient absorption. If you have ever searched for information about plant nutrition and pH, you might remember finding a lot of charts showing the nutrient availability as a function of the pH – as shown in the image below – however, you might have also noticed that most of these images do not have an apparent source. Where does this information on pH availability come from? What experimental evidence was used to derive these graphs? Should we trust it? In this post, we are going to look at where these “nutrient availability” charts come from and whether or not we should use them when working in hydroponic crops.

A google search in 2021 showing all the different versions of the same nutrient availability plots.

Information about the above charts is not easy to come by. People have incessantly copied these charts in media, in peer reviewed papers, in journals, in websites, etc. Those who cite, usually cite each other, creating circular references that made the finding of the original source quite difficult. However, after some arduous searching, I was able to finally find the first publication with a chart of this type. It is this white paper from 1942 by Emil Truog of the University of Wisconsin. The paper is titled “The Liming of Soils” and describes Truog’s review of the “state of the art” in regards to the liming of soils in the United States and the differences in nutrient availability that different pH levels – as set by lime – can cause.

The paper is not based primordially on judicious experiments surrounding nutrient availability but on Truog’s experience with limed soils and the chemistry that was known at the time. He acknowledges these limitations explicitly in the paper as follows:

I also emphasize that the chart is a generalized diagram. Because adequate and precise data relating to certain aspects of the subject are still lacking, I had to make some assumptions in its preparation and so there are undoubtedly some inaccuracies in it. There will be cases that do not conform to the diagram because of the inaccuracies, or special and peculiar conditions that are involved, e. g., conditions that are associated with orchard crops.

“The liming of soils” by Emil Truog

It is therefore quite surprising that we continue to use this diagram, even though there have been more than 80 years of research on the subject and we now know significantly more about the chemistry of the matter. Furthermore, this diagram has been extended to use in hydroponics, where it has some very important inaccuracies. For example, Truog’s decision to lower nitrogen availability as a function of pH below 6 is not based on an inability of plants to absorb nitrogen when the pH drops, but on the observations done in soil that showed that below this value, the bacteria present in soil could not effectively convert organic nitrogen into nitric nitrogen, the main source of nitrogen that crops can assimilate. In hydroponics, where nitrate is provided in its pure form, nitrate availability does not drop as the pH of the solution goes down.

Several other such assumptions are present in his diagram. Since the changes in pH he observed are associated with lime content, the drops in availability are as much a consequence of pH increase as they are of increases in the concentration of both calcium and carbonates in the media. This significantly affects P availability, which drops substantially as the increase in pH, coupled with the increase in Ca concentration, causes significant precipitations of Ca phosphates. His diagram also ignores key developments in the area of heavy metal chelates, where the absorption of heavy metal ions can be unhindered by increases of pH due to the use of strong chelating agents.

The original pH availability chart as published by Truoug in the 1940s. It has been copied without barely any modification for the past 80 years.
Diagram from the 1935 paper by N.A. Pettinger

Reading further into Truog’s paper, I found out that his diagram is actually an extension of a diagram that was created almost 10 years before, in 1935, by N. A. Pettinger, an associate agronomist at the Virginia Agricultural Experiment station. You can read this white paper here. In a similar fashion, Pettinger created a diagram that summed his experiences with different nutrients in soils at different pH values, where the pH was mainly increased or decreased by the presence or absence of lime. You can see big differences between both diagrams, while Truog includes all elements required by plants, Pettinger only includes the most highly used nutrients, leaving Zn, B, Mo, and Cu out of the picture. Pettinger also has substantially different availability profiles for Mg and Fe.

Although these diagrams are both great contributions to the field of agronomy and have been used extensively for the past 80 years, I believe it is time that we incorporate within these diagrams a lot of the knowledge that we have gained since the 1950s. I believe we can create a chart that is specific to nutrient availability in hydroponics, perhaps even charts that show availability profiles as a function of different media. We have a lot of experimental data on the subject, product of research during almost a century, so I believe I will raise up to the challenge and give it my best shot. Together, we can create a great evidence-based chart that reflects a much more current understanding of nutrient availability as a function of pH.


Understanding Calcium deficiency issues in plants

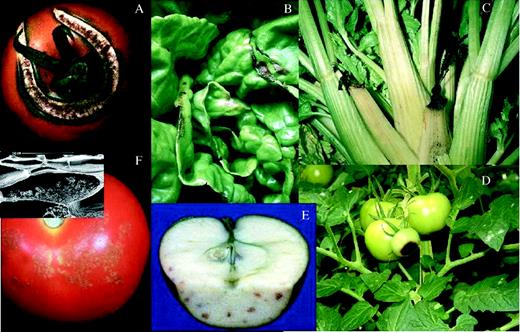
Calcium is one of the most difficult elements to properly supply to plants as its absorption is tightly linked to both chemical and environmental factors. It is very easy for growers to suffer from calcium-related problems, especially those who are growing under highly productive conditions. Issues such as bitter pit in apples, black heart in celery, blossom end rot in tomato, and inner leaf tip burn in lettuce, have all been associated with low levels of calcium in the affected tissues. In this post, we are going to discuss why this happens, how it is different for different plants, and which strategies we can use to fix the issue and get all the calcium needed into our plants’ tissue. Most of the information on this post is based on these two published reviews (1, 2, 3).

Problems with Ca absorption rarely happen because there is not enough Calcium available to a plant’s root system. In hydroponic crops, these issues happen when ample Ca is available to plant root systems and can present themselves even when apparently excess Ca is present in the nutrient solution. Concentrations of 120-200 ppm of Ca are typically found in hydroponic solutions and we can still see cases where nutrient Ca-related problems emerge. This is because issues with Ca are mostly linked to the transport of this element from roots to tissues, which is an issue that is rarely caused by the concentration of Ca available to the plants. Most commonly these problems are caused by a plant that is growing under conditions that are very favorable and Ca transport fails to keep up with other, more mobile elements. As the plant fails to get enough Ca to a specific growing point, that tissue will face a strong localized Ca deficiency and will die.

Calcium issues in different plants. Taken from this review.

When looking into a Ca problem and how to fix it, we first need to understand which plant organ is lacking proper Calcium uptake. In tomato plants, for example, blossom end rot (BER) appears when Ca fails to reach a sink organ – the fruit – while in lettuce, inner tip burn develops because Ca is unable to reach a fast-growing yet photosynthetically active part of the plant. Since Calcium transport can be increased by increasing transpiration, we might think that decreasing the relative humidity (RH) might reduce BER but this in fact increases it, because transpiration increases faster in leaves, than it does in the fruit. In this case, solving the problem involves balancing Ca transport so that it reaches the fruit instead of the leaves. Pruning of excessive leaf tissue, lowering N to reduce vegetative growth, and increasing RH – especially at night – can in fact help under these circumstances, where Ca deficiency develops in sink organs. Reducing ammonium as much as possible can also help, as ammonium can also antagonize calcium absorption due to its cationic nature.

In plants like cabbages and lettuce, a different picture emerges. In this case, increasing the RH leads to worse tip burn symptoms, and decreasing it significantly reduces tip burn, as Ca transport is increased by the increased leaf transpiration. This can be a viable strategy if the temperature is not too high. Under high temperatures, reducing RH leads to too much water stress, which causes other problems for the plants. In these cases, a preferred technique to reduce tip burn is to increase air circulation, which decreases both the RH around leaf tissue and the temperature of the plant due to the wind-chilling effect, this can increase transpiration rates without overly stressing plants.

Taken from this review.

Since in most cases these Ca issues are associated with fast growth, most measures that reduce growth will tend to reduce the severity of the Ca symptoms. Reducing the EC of solutions, reducing temperatures, and decreasing light intensity are some of the most popular mechanisms to reduce Ca problems by reducing plant productivity. These might be the most economical solutions – for example, if artificial lights are used – but it might not be favored by many growers due to the fact that it requires a sacrifice in potential yields. A potential way to attack Ca issues through growth control without reducing yields is to use growth regulators in order to suppress vegetative growth. Synthetic and natural gibberellin inhibitors are both effective at this task.

A common strategy to tackle these Ca issues is to perform foliar sprays to correct the deficiency. Weekly, calcium nitrate or calcium chloride foliar sprays can help alleviate symptoms of tip burn and black heart. Spraying plants from a young age, to ensure they always have Ca in their growing tips, is key. When performing these sprays, primordially make sure all growing tips are fully covered, as Ca sprayed on old tissue won’t really help the plant, as Ca cannot be transported from old to young leaves.


Disinfection of nutrient solutions in recirculating hydroponic systems

Plant growing systems that recirculate nutrients are more efficient in terms of fertilizer and water usage than their run-to-waste counter-parts. However, the constant recirculation of the nutrient solution creates a great opportunity for pathogens and algae to flourish and colonize entire crops, with often devastating results. In this post, we are going to discuss the different alternatives that are available for disinfection in recirculating crops, which ones offer us the best protection, and what we need to do in order to use them effectively. I am going to describe the advantages and disadvantages of each one so that you can take this into account when choosing a solution for your hydroponic crop.

Disinfection of recirculating nutrient solutions has been described extensively in the scientific literature, the papers in the following links (1,2,3,4) offer a good review of such techniques and the experimental results behind them. The discussion within this post makes use of the information within these papers, as well as my personal experience while working with growers all over the world during the past 10 years.

Image result for slow sand filtration
A slow sand filtration system will be effective at filtering most fungal and bacterial spores, but is slow. Image taken from here.

In order to kill the pathogens within a hydroponic solution, we can use chemical or non-chemical methods. Chemical methods add something to the nutrient solution that reacts with the molecules that make up pathogens, killing them in the process, while non-chemical methods will add energy to the nutrient solution in some form or filter the solution in order to eliminate undesired microbe populations. Chemical methods will often affect plants – since the chemicals are carried away with the nutrient solution – and require constant adjustments since the levels of these chemicals within the nutrient solutions need to be controlled quite carefully.

Chemical methods include sodium hypochlorite, hydrogen peroxide, and ozone additions. From these choices, both hypochlorite and hydrogen peroxide have poor disinfection performance at the concentrations tolerated by plants and are hard to maintain at the desired concentrations through an entire crop cycle without ill effects. Ozone offers good disinfection capabilities but requires additional carbon filtration steps after injection in order to ensure its removal from the nutrient solution before it contacts plant roots (since it is very poorly tolerated by plants). Additionally, ozone sterilization requires ozone sensors to be installed in the facility in order for people to avoid exposure to high levels of this gas, which is bad for human health. In all of these cases, dosages can be monitored and controlled to a decent level using ORP meters, although solely relying on ORP sensors can be a bad idea for substances like hypochlorite as the accumulation of Na and Cl can also be problematic.

The most popular non-chemical methods for disinfection are heat treatment, UV radiation, and slow sand filtration. Slow sand filtration can successfully reduce microbe populations for fungi and bacteria but the slow nature of the process makes it an inadequate choice for larger facilities (>1 ha). Heat treatment of solutions is very effective at disinfection but is energetically intensive as it requires heating and subsequent cooling of nutrient solutions. For large facilities, UV sterilization offers the best compromise between cost and disinfection as it requires little energy, is easy to scale, and provides effective disinfection against a wide variety of pathogens if the dosage is high enough. It is however important to note that some UV lamps will also generate ozone in solution, which will require carbon filtration in order to eliminate the ill effects of this chemical. If this wants to be avoided, then lamps that are specifically designed to avoid ozone generation need to be used.

Loss in soluble Fe as a function of UV radiation time. Taken from here. Note that this is irradiation time -not nutrient solution life – in a normal crop it will take 10x the time to accumulate the level of radiation since solution is not under radiation for most of the time.

If you want to use UV sterilization, you should carefully consider the power of the lamps and the flow rate needs in order to ensure that you have adequate sterilization. Most in-line UV filters will give you a flow rate in GPH at which they consider the dosage adequate for disinfection, as a rule of thumb you should be below 50% of this value in order to ensure that the solution is adequately disinfected as some pathogens will require radiation doses significantly higher than others. You can also add many of these UV filters in parallel in order to get to the GPH measurement required by your crop. UV sterilization also has a significant effect on all microbe populations in the environment (5) so consider that you will need to inoculate with more beneficial microbes if you want to sustain microbe populations in the plants’ rhizosphere.

With all these said, the last point to consider is that both chemical and UV sterilization methods will tend to destroy organic molecules in the nutrient solution, which means heavy metal chelates will be destroyed continuously, causing precipitation of heavy metals within the nutrient solution as oxides or phosphates. As a rule of thumb, any grower that uses any method that is expected to destroy chelates should add more heavy metals routinely in order to replace those that are lost. To calibrate these replacements, Fe should be measured using lab analysis once every 2 days for a week, in order to see how much Fe is depleted by the UV process. Some people have tried using other types of Fe chelates, such as lignosulfates, in order to alleviate this issue as well (6).


Optimal air speed in a hydroponic crop

Wind speed is a particularly important, yet often overlooked variable in hydroponic crops. While growers in greenhouses will pay close attention to overall gas exchange characteristics (how much air exits and enters a greenhouse) the speed of air around plant canopy is commonly not measured or optimized to maximize plant growth. In this post we will talk about why air speed is so important, why it needs to be measured around the canopy, and what you should be aiming to achieve within your hydroponic greenhouse or grow room.

Plants at higher wind speeds

The airflow around a plant will completely change the plant’s environment. As air flows around the plant it will carry away oxygen and water and will replenish carbon dioxide. Besides this, the moving air will also dramatically increase heat transfer due to convection, effectively cooling the plant substantially (this is known as wind-chill) (1). Without any air movement, the plant will saturate the air immediately around it with oxygen and water and deplete it of carbon dioxide during the day, relying solely on diffusion across this depleted layer in order to get additional carbon dioxide. This will heavily limit the plant’s ability to photosynthesize and will generally cause plants to be stunted and with a higher propensity for fungal/bacterial disease (since there is a very high relative humidity layer adjacent to the leaves).

As airflow increases, so will the plant’s metabolism. This will happen up to a point where the effects of wind chill or mechanical stress due to the air movement become too high. At low relative humidity values, high wind speeds will also pressure the plant to increase water transpiration substantially as the flowing dry air will strip the plant of humidity more efficiently. Due to this reason, optimal relative humidity will tend to be higher as airspeeds at the canopy increase. It is often quite common that to achieve optimal VPD – which often requires high humidity values at high temperatures – airspeed around plants needs to be increased to avoid fungal issues.

The airspeed around the canopy can be bad even if the in/out exchange characteristics of a room are optimal. This is because the flow of air into or out of a room says nothing about how the air is circulating through that room. Since air is a gas, it will go through paths of least resistance and will try to avoid the canopy – a very prominent obstacle – if it is allowed to. For this reason, intake/outtake structures that force air to go through the canopy and fan setups that direct air straight at the canopy structure are going to be significantly more effective at generating proper airflow. Since airspeeds around the canopy are going to be quite low (0-1m/s), it is not possible to measure these speeds accurately with regular fan-base anemometers, a hot wire anemometer will be required to make these readings. These devices will allow you to measure wind speeds that are quite low, with an accuracy of +/-0.1m/s.

A hot wire anemometer that can be used to accurately measure wind speeds around plant canopy

So what is the optimal airspeed you should be aiming for at plant canopy? The higher the airspeed, the higher your plant metabolism will tend to be and the more pressure the plant will feel to adapt to these environmental conditions. At some point, the plant is unable to benefit from increases in airspeeds due to the increased transpiration and wind-chill caused by the increased air-movement. The results of a study on tomato plants with different leaf area index (LAI) values in wind tunnels are shown below. As you can see, crops with lower LAI values will tend to do be photosynthetically more efficient, probably because these low LAI values are more adapted to higher airflow conditions. However, this does show that a limit to increases in photosynthetic rate based on airflow does exist.

To reach optimal photosynthetic rates, the wind speed around the canopy should be at least 0.3m/s, as this is around the point where flowering plants like tomatoes start reaching a plateau of photosynthetic production. Having a higher rate will provide little additional benefits under normal conditions, although aiming for 0.5-0.6m/s might provide a buffer to ensure that all regions of the canopy are above the critical 0.3/s threshold. Aim to have a homogeneous flow across the canopy in the entire room/greenhouse as you would have in a wind-tunnel. Higher airspeeds might be desirable if CO2 enrichment is being done, although care must be taken to ensure that the relative humidity is high enough to account for the additional wind chill that the plants are going to be subjected to. Also, aim to have these airflow conditions through the entire life of the plant, as early adaptations to the airflow regime will tend to limit what can be achieved by trying to increase airflow at a later time.

Photosynthetic rate as a function of windspeed, LAI stands for (Leaf Area Index). Taken from this article.

When possible, make sure you compare the LAI values of the different plants you have available. Low LAI values are going to be more suited to high density crops as their efficiency per leaf area unit will be significantly higher and it will be easier to maintain high airflow speeds within the canopy, while crops with high LAI values will make it more difficult for air to move through the canopy plus their photosynthetic efficiency per leaf area unit will be substantially lower.


Advanced phosphorous fertilizers: Are polyphosphates worth it?

If you look into mineral phosphate fertilizers, most of them are of the orthophosphate variety, where phosphorous is present in the form of PO4-3 anions with varying degrees of hydrogen additions depending on the charge balance of the salts. However, there are several different varieties of phosphorous that can be used to fertilize crops. Since the 1970s, polyphosphates have been researched and sold by several different fertilizer companies as a “better way” to fertilize crops. In this post I am going to talk about what polyphosphates are, what the differences with regular orthophosphate fertilizers are, and whether it is worth it or not to replace your current phosphorous fertilization for a regime including or consisting exclusively of these polyphosphates.

Image result for ammonium polyphosphate
Chemical structure of ammonium polyphosphate

Traditional fertilizers like Mono Potassium Phosphate, MKP (KH2PO4) will contain phosphorous in a chemical state that is readily available to plants. The HPO4-2 and H2PO4 that are generated from this salt in water at a pH between 6-7 are favorably and effectively taken up by plants under normal conditions. However, upon significant presence of calcium/magnesium minerals or high pH levels, it is common for a lot of the phosphorous to become trapped in the form of insoluble phosphates. These calcium and magnesium phosphates will be unavailable to plants and the soil will quickly become P limited, making P fertilization difficult due to the eagerness with which the soil chemistry can sequester the added phosphate.

Polyphosphates like ammonium polyphosphate (APP), where the phosphorous is not present as single phosphate anions but as a complex P polymer, can overcome some of the above problems as their tendency to form insoluble salts with cations is suppressed and their solubility is significantly higher. Their use in calcium-rich soils has been proven experimentally multiple times, the following reference provides an example of this (1). However, is there any benefit provided beyond their superiority in this type of high pH and high Ca conditions?

The chemical properties of APP have been extensively studied and we know that many of their benefits in comparison with orthophosphate (OP) salts are eliminated by a simple move towards acidic pH (2,3). Field experiences have shown that when the soil conditions are not this bad, the differences between APP and OP are expected to be low (4,5). Under normal pH and ion-concentration conditions, APP seems to provide very similar results to normal sources of phosphate, as it will tend to hydrolyze and form these phosphates with time anyway. This effect can be especially dramatic in more acidic media, where the decomposition of these phosphates can be quite rapid (6).

Image result for polyphosphate orthophosphate fertilizer study
If soil conditions are not unfavorable, poly and ortho phosphates will give the same result. Taken from this study.

To sum things up, under normal conditions, polyphosphate is no better than your normal sources of phosphorous. If you are running a hydroponic setup within a normal pH range and nutrient concentrations, polyphosphates are just a more expensive way to add phosphorous to your system, they will likely provide no added benefit in terms of yields or crop health compared to using regular phosphate fertilizers. However, if you are growing your crops in a Ca-rich soil that is particularly high pH, where P sequestration due to precipitation is a substantial issue, then polyphosphates offer an alternative method of fertilization that is likely to increase yields against normal orthophosphate fertilizers.


Keeping plants short: Natural gibberellin inhibitors

In this series of posts, we have discussed the different techniques and synthetic chemical substances that can be used to keep plants short. We discussed why keeping plants short is important, how this can be done with synthetic gibberellin inhibitors and how this can also be achieved using day/night temperature differentials. However, there are also a lot of natural substances that can be used to inhibit gibberellins, which can be used to help us achieve this same objective. In this post, we will be talking about the research around natural gibberellin inhibitors, the plant extracts that have shown this activity and what we have discovered these plant extracts contain.

Image result for carob plant
Dried seeds and fruits of the carob plant

Research around plant extracts that could inhibit gibberellins started in the late 1960s. Many different plant extracts were tested for inhibitory activity. The tests were simple, a control plant was not sprayed, a second gibberellin control plant was sprayed with gibberellins and a third plant was sprayed with a mixture of gibberellins and the tested plant extract. Whenever inhibitory activity was present, the third plant would show very similar characteristics to the control while the gibberellin sprayed plant would usually stretch significantly. You usually see graphs like the one showed below, where the plant sprayed with the pure gibberellins is the control while the extract contains both the gibberellins and the plant extract. When an extract inhibits the gibberellins the plant grows less under the same gibberellin concentration although as the gibberellin concentration is increased the inhibitory effect of the extract is surpassed and the plants reach similar points.

When doing this research, one of the plants that showed the most promise was the carob plant. Cold-pressed extracts of green carob fruits were studied quite extensively and showed this effect repeatedly (1, 2, 3). Different fractions extracted showed the effect and researchers sought to find the specific substances responsible for the inhibition. Eventually, researchers found that the culprit was abscisic acid (4), also known as ABA. Other plant extracts that had gibberellin inhibitory effects, such as lima beans, also proved to contain significant amounts of ABA (5). So why are we not using ABA as a safe and environmentally friendly gibberellin inhibitor?

Sample graph showing the gibberelin inhibitory effect of a natural extract obtained from carob (taken from here)

It boils down to the chemistry of ABA, which is quite complicated. First of all, ABA contains a chiral center (1′ in the image below), making it the first chiral plant hormone to be discovered. This means that its mirror images are not equivalent – like your right hand is not equivalent to your left hand – which means that these two chemical forms will behave differently in biological systems. This complicates the synthesis of the molecule substantially. Furthermore, ABA contains several double bonds, which, depending on their configuration, can make the molecule completely inactive. Unfortunately, ABA goes through a double bond rearrangement under UV light that causes the molecule to deactivate, making it unstable for everyday use. So while ABA was great on paper, in practice it was never used widely. Several chemical analogs of ABA were developed and a lot of chemistry surrounding ABA and the proteins it binds to have been explored (you can read more in this book).

Phenolic compounds were also of great interest in the 1970s since many of the plant extracts that showed inhibitory activity also contained many of these molecules. These belong to a family of compounds called “tannins” and were then explored in pure form as potential gibberellin inhibitors, with many of them showing substantial activity (6, 7, 8). This showed that extracts coming from fruits like carob had an inhibitory activity that was independent of the activity they got from ABA, although the phenolic compounds were significantly less active compared to the pure plant hormone.

Image result for ABA molecule
Labeled diagram of the active form of ABA

In the late 1970s, the research into these natural gibberellin inhibitors stopped as the first successful synthetic gibberellin synthesis inhibitors started to surface. These were much more effective since they did not deal with the gibberellin once produced but mostly attacked the paths that were used to form the chemical within the plants. Substances such as Chloromequat and Paclobutrazol made most of this research into naturally source inhibitors irrelevant, as these were cheap to produce in mass quantities and much more effective.

With the return towards safer and more natural alternatives and advances in chemical synthesis, the direct use of ABA or phenolic substances in order to inhibit gibberellins to prevent shoot elongation starts to become attractive. If you’re interested in this path, looking at past research from the 1970s to come up with test formulations for foliar spray or root drench products would be a good initial approach. If you want to avoid the use of pure substances and all chemical synthesis, using direct extracts from plants like lima beans and carob is also a potential approach, although care needs to be taken to ensure the conditions of the extraction processes and extract storage do not destroy their active properties.


Five common mistakes people make when formulating hydroponic nutrients

It is not very difficult to create a basic DIY hydroponic formulation; the raw salts are available at a very low cost, and the target concentrations for the different nutrients can be found online. My nutrient calculator – HydroBuddy – contains large amounts of pre-made formulations in its database that you can use as a base for your first custom hydroponic endeavors. However, there are some common mistakes that are made when formulating hydroponic nutrients that can seriously hurt your chances of success when creating a hydroponic recipe of your own. In this post I will be going through the 5 mistakes I see most often and tell you why these can seriously hurt your chances of success.

Failing to account for the water that will be used. A very common mistake when formulating nutrients is to ignore the composition of the water that you will be using and how your hydroponic formulation needs to account for that. If your water contains a lot of calcium or magnesium then you will need to adjust your formulation to use less of these nutrients. It is also important not to trust an analysis report from your water company but to do a water analysis yourself, since water analysis reports from your water company might not be up to date or might not cover the exact water source your water is coming from. It is also important to do several analyses per year in order to account for variations in the water composition due to temperature (which can be big). Other substances, such as carbonates and silicates also need to be taken into account in your formulation as these will affect the pH and chemical behavior of your hydroponic solution.

Failing to account for substances needed to adjust the pH of the hydroponic solution. When a hydroponic solution is prepared, the pH of the solution will often need to be adjusted to a pH that is within an acceptable range in hydroponics (often 5.8-6.2). This is commonly achieved by adding acid since when tap/well water is used, a substantial amount of carbonates and/or silicates will need to be neutralized. Depending on the salt choices made for the recipe, adjustments could still be needed even if RO water is used. Since these adjustments most commonly use phosphoric acid, not accounting for them can often cause solutions to become very P rich with time, causing problems with the absorption of other nutrients, especially Zn and Cu. A nutrient formulation should account for the pH corrections that will be required and properly adjust the concentration of nutrients so that they will reach the proper targets considering these additions.

Iron is chelated but manganese is not. It is quite common in hydroponics for people to formulate nutrients where Fe is chelated with EDTA and/or DTPA but manganese sources are not chelated at all, often added from sulfates. Since manganese has a high affinity for these chelating agents as well, it will take some of these chelating agents from the Fe and then cause Fe phosphates to precipitate in concentrated solutions. To avoid this problem, many nutrient solutions in A/B configurations that do not chelate their Mn will have the Fe in the A solution and then the other micronutrients in the B solution. This can be problematic as it implies the Fe/other micro ratios will change if different stages with different A/B proportions are used through the crop cycle. In order to avoid this issue, always make sure all the micronutrients are chelated.

Not properly considering the ammonium/nitrate ratio. Nitrogen coming from nitrate and nitrogen coming from ammonium are completely different chemically and absorbed very differently by plants. While plants can live with solutions with concentrations of nitrogen coming from nitrate as high as 200-250ppm, they will face substantial toxicity issues with solutions that contain ammonium at only a fraction of this concentration. It is therefore quite important to ensure that you’re adding the proper sources of nitrogen and that the ratio of ammonium to nitrate is in the ideal range for the plants that you’re growing. When in doubt, plants can survive quite well with only nitrogen from nitrate, so you can completely eliminate any additional sources of ammonium. Note that urea, provides nitrogen that is converted to nitrogen from ammonium, so avoid using urea as a fertilizer in hydroponic.

Not considering the media composition and contributions. When growing in hydroponic systems, the media can play a significant role in providing nutrients to the hydroponic crop and different media types will provide nutrients very differently. A saturated media extract (SME) analysis will give you an idea of what the media can contribute and you can therefore adjust your nutrient solution to account for some of the things that the media will be putting into the solution. There are sadly no broad rules of thumb for this as the contributions from the media will depend on how the media was pretreated and how/if it was amended. It will often be the case that untreated coco will require formulations with significantly lower K, while buffered/treated coco might not require this. Some peat moss providers also heavily amend their media with dolomite/limestone, which substantially changes Ca/Mg requirements, as the root system


Using VH400 sensors to build an automated irrigation setup

I have written several posts in the past about the measurement of water content in media, I have covered some very low cost and easy to use sensors that can also be plugged into Arduinos using i2c as well as some of the more accurate sensors you can get for this in hydroponics. However, there are several companies that offer more plug-and-play solutions for the monitoring of moisture in media and the setup of automated irrigation schemes using these measurements. The company Vegetronix offers moisture sensors that are insensitive to salt in media that can be plugged straight into boards that contain relays that can be used to control irrigation pumps. In this post, we will talk about these sensors, how they operate and how you could use them to automate irrigation within your growing room or greenhouse without much coding or setup efforts required. This post is not sponsored by Vegetronix and I have no association with them.

Soil Moisture Sensor
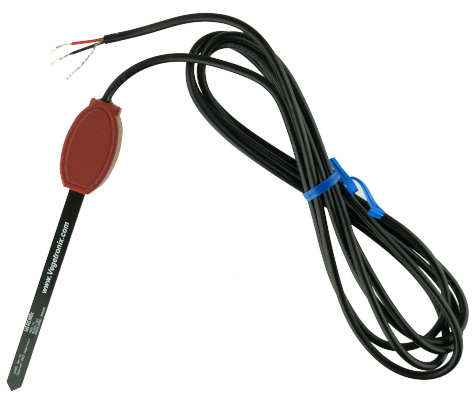
The VH400 moisture sensor

The main offering of Vegetronix in terms of moisture monitoring is their VH400 sensor, this sensor has the advantage of being completely waterproof and rugged in construction. It can be placed deep inside media – right next to the root ball – which is a huge advantage in hydroponic setups that use cocoa or peat moss and use large amounts of media per plant. The small size of the sensor also means that this will be more practical for something like rockwool compared with a sensor like the chirp, which has exposed circuity and cannot be fully submerged. In addition, the VH400 is also suitable for outdoor use. Another thing I like about these sensors is that they are analogue and can therefore be interfaced quite simply with Arduinos or other such control mechanisms, making them great for DYI. This would make them a great candidate to interface with a cricket board, which I showed in a recent post.

The technology used in these sensors is however kept secret. Given that the sensor has no exposed ceramic or metal leads, it would be fair to assume that it is capacitive in nature and probably uses a technology similar to the Chirp sensor, although it is difficult to know precisely how it carries the measurements without doing some heavy reverse-engineering of the sensors. One of its key features though is that it is unaffected by salinity, which is a key requirement for accurate measurements in hydroponics, and – given the lack of exposed metal leads – we are sure this is not a resistive sensor. Vegetronix does not seem to hold any patents on the sensor – please correct me if I’m wrong – so it is fair to assume that the technology is probably well within the well-known techniques in the field.

It is worth noting however that – although advertised as “unaffected by salinity” – it will require routine maintenance, washing with distilled water to reduce salt accumulation and recalibration to ensure it is giving accurate moisture content measurements. As with all moisture sensors, adequate calibration and monitoring of sensors is fundamental to long term success with them. If these sensors are not maintained they will stop giving proper readings with time, especially if they are buried around the root zone of plants in hydroponic setups.

Another important point is that these are low cost sensors and have significant fabrication differences between them, proper and individual calibration of all sensors is required for proper quantitative use.

Latching Relay Board for Moisture Sensors
Vegetronix battery powered relay sensor

With the sensors in mind, we can now discuss the relay boards that make this choice quite attractive. The board shown above, which you can find here, is a battery-powered sensor that links to a single VH400 sensor to trigger a pump at a given moisture sensor threshold. All it takes to use this sensor is to perform a calibration procedure using the VH400 sensor and use the screw on the board to set the point where you want the relay to trigger. The board is 60 USD and the VH400 is 40 USD – at the shortest cable length – so with these two sensors you can set up a quite decent irrigation setup that is fully automated and battery-powered, with minimal wiring required.

However, if you want a more extensive setup, you can get their relay hub, which can connect to popular cloud data services in order to send your data to the cloud while also being battery-powered and allowing for triggering of an irrigation system using multiple sensor readings or input from the cloud. Although this relay box is more expensive, at near 150 USD when you consider the battery accessories, it does provide you with a lot of additional options if you want access to remote monitoring of your moisture sensors. Since it can relay the data to third-party sites like thingspeak, it would be relatively easy for an experienced programmer to hook all that data into a central database to put it together with data from other sensors.

So although the Vegetronix sensors are not my preferred solution if a fully DIY setup is possible – if enough time, experienced personnel, and financial resources are available – I do believe that they make a very good value offer for those who want a decently accurate setup to monitor soil moisture content without the hassle of having to deal with the complications of a fully DIY setup. Their boards offer both super simple, low-cost solutions and more elaborate solutions for those who give more importance to data logging and monitoring. If you aren’t controlling your irrigation with moisture sensors, a quick 100 USD setup of VH400+battery powered relay station is a huge step in the right direction.