Growing Soilless Crops Without Nitrates: Practical Options When Nitrate Salts Are Unavailable
For growers in regions where geopolitical conflicts or economic constraints limit access to nitrate fertilizers like calcium nitrate and potassium nitrate, the question arises: can you grow hydroponic or soilless crops using only alternative nitrogen sources? The short answer is yes, but with important limitations and necessary substrate modifications. This post explores the science behind nitrate-free soilless growing and practical strategies for growers facing nitrate scarcity.
Why Nitrates Dominate in Hydroponics
In conventional hydroponics, 85-95% of nitrogen is supplied as nitrate (NO3-) rather than ammonium (NH4+). This preference exists for good reasons. Plants can safely store nitrate in vacuoles without toxicity, while ammonium accumulation in plant tissues causes rapid damage (1). In soil, nitrifying bacteria convert ammonium to nitrate before plant uptake, but most soilless substrates lack these microbial communities. Without this conversion, ammonium concentrations that would be harmless in soil become highly toxic in hydroponics.
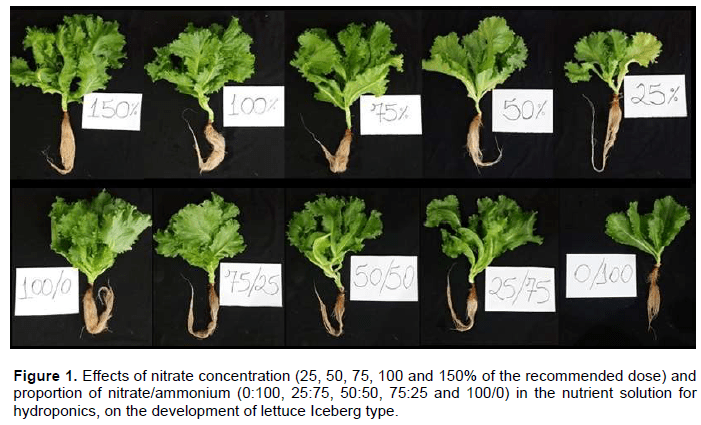
Research on tomatoes shows that plants supplied with 112 ppm nitrogen as ammonium developed severe toxicity symptoms and produced only one-third the biomass of nitrate-fed plants (1). Even at 14 ppm nitrogen, ammonium-only nutrition suppressed growth compared to mixed nitrogen sources. For lettuce, similar effects occur, with crown discoloration and biomass reductions appearing at 50 ppm ammonium nitrogen (2).
Maximum Safe Ammonium Levels
The tolerance threshold varies by species and conditions, but general guidelines exist:
| Crop Type | Maximum Safe Ammonium (% of total N) | Maximum Concentration (ppm N) |
| Most crops (standard) | 10-15% | 15-30 ppm |
| Sensitive crops (tomato, pepper, lettuce) | 5-10% | 10-20 ppm |
| Cold conditions (<15°C) | 0-5% | 0-10 ppm |
| High light, fast growth | 15-20% | 20-40 ppm |
These limits exist because ammonium uptake is passive and rapid, plants cannot regulate it effectively, and it disrupts calcium and magnesium uptake while acidifying the root zone (3).
Substrate Amendments: Creating Artificial Soil
The key to using higher ammonium levels or organic nitrogen sources is establishing nitrifying bacteria in the substrate. Recent research demonstrates that soilless substrates can be inoculated with microbial communities that convert organic nitrogen to nitrate (4).
Effective substrates for nitrification include rockwool, vermiculite, polyurethane foam, oyster shell lime, and rice husk charcoal. The process requires:
- Inoculum source: Bark compost or mature vermicompost provides ammonia-oxidizing bacteria (AOB) and nitrite-oxidizing bacteria (NOB). Add 1g per 100mL substrate initially.
- Temperature: Nitrifying bacteria function optimally at 25-42°C. Below 15°C, nitrification slows dramatically, causing ammonium accumulation (5).
- Humidity and aeration: Substrates need >50% relative humidity and adequate oxygen. Waterlogged conditions inhibit nitrification and promote denitrification.
- Establishment period: Allow 2-3 weeks for bacterial colonization before planting. Daily additions of dilute organic fertilizer (6 mg N per 100mL substrate) accelerate establishment.
Practical Nitrogen Sources
Ammonium Salts
Ammonium sulfate ((NH4)2SO4) is the most accessible ammonium source globally. At 21% nitrogen, it provides both N and sulfur. However, use caution:
- Never exceed 20% of total nitrogen as ammonium in solution
- Monitor substrate pH closely, as ammonium uptake releases protons and acidifies the root zone
- Increase ratios only under high light and warm temperatures (>20°C)
- Sensitive crops like lettuce, tomato, and pepper tolerate lower ratios
Ammonium phosphate (MAP or DAP) offers nitrogen plus phosphorus but requires even more careful management due to rapid pH shifts.
Urea
Urea (CO(NH2)2) at 46% nitrogen is economical and widely available. In water, urease enzymes (either from bacteria or added exogenously) hydrolyze urea to ammonium. However, hydroponic studies on various crops show that urea performs poorly as a sole nitrogen source (6). Plants fed only urea exhibited nitrogen deficiency symptoms at low concentrations and toxicity at high concentrations. The primary issues are:
- Insufficient uptake of intact urea by most crop species
- Variable conversion rates without soil bacteria
- pH instability during hydrolysis
Combined applications of urea with nitrate showed better results than urea alone, but if nitrates are unavailable, urea offers limited benefit beyond what ammonium salts provide (6).
Compost and Organic Extracts
Compost leachates and vermicompost teas contain nitrogen primarily as proteins, amino acids, and ammonium. Direct use in inert hydroponics fails because plants cannot efficiently absorb complex organic nitrogen. However, two approaches work:
Aerobic nitrification method: Add organic nitrogen sources like corn steep liquor (1g/L) or fish emulsion plus bark compost (0.5g/L) as bacterial inoculum. Aerate for 12 days, during which bacteria convert organic N and ammonium to nitrate, reaching 100-130 ppm N as nitrate (7). This creates a low-cost, nitrate-containing solution from readily available materials.
Substrate-based mineralization: Inoculate substrates with compost microbes and apply dilute organic fertilizers daily. The substrate acts as a biofilter, mineralizing organic N to nitrate before plant uptake (4). This method requires 2-3 weeks establishment and careful moisture management.
Expected Yield Impacts
When managed properly with substrate amendments and bacterial communities, yields can approach conventional hydroponic levels. Studies show that tomatoes grown with nitrified organic solutions performed comparably to mineral fertilizer controls when adequate nitrate was generated (7).
However, several factors reduce yields in poorly managed nitrate-free systems:
- Ammonium toxicity: High ammonium causes 30-70% yield reductions across most crops (1)
- Nutrient imbalances: Ammonium competes with Ca2+ and Mg2+ uptake, inducing deficiencies
- pH instability: Root zone acidification from ammonium uptake reduces nutrient availability
- Incomplete mineralization: Organic N sources may not fully convert to plant-available forms
Realistic expectations for growers transitioning to nitrate-free systems:
- First crop cycle: 50-70% of conventional yields while optimizing conditions
- Established systems with functioning bacterial communities: 80-95% of conventional yields
- Cold season growing (<15°C): 40-60% due to impaired nitrification
Nutrient Solution Modifications
Without calcium nitrate, calcium must come from chloride or sulfate sources rather than nitrate. Calcium chloride is highly soluble but adds chloride. Gypsum (calcium sulfate) doesn’t have the solubility needed to make concentrated stock solutions and therefore can only be added to the final solutions or added to the media as an amendment. Calcium chloride can add unwanted high amounts of chlorides as it’s therefore best avoided. If you are doing composting amendments then limestone amendments might be the most desirable way to supply Ca to the crop.
Critical Success Factors
To successfully grow soilless crops without nitrate fertilizers:
- Establish nitrifying bacteria: This is non-negotiable for using organic N or high ammonium levels
- Monitor pH constantly: Ammonium acidifies solutions; maintain pH 5.8-6.5 through buffering or base addition
- Provide adequate calcium: Use calcium chloride or sulfate since calcium nitrate is unavailable
- Keep temperatures warm: >20°C substrate temperature for bacterial activity
- Start conservatively: Begin with 10% ammonium and increase gradually as plants adapt
- Choose tolerant species first: Leafy greens like pak choi are more tolerant than tomatoes or peppers
Conclusion
Growing soilless crops without nitrates is achievable but requires different management than conventional hydroponics. The approach depends on creating conditions that mimic soil processes, establishing microbial communities to convert ammonium and organic nitrogen to nitrate within the substrate. While yields may initially be lower, proper substrate inoculation, temperature management, and careful nitrogen source selection can produce acceptable results. For growers with limited access to nitrate salts, combining small amounts of ammonium sulfate (20-30 ppm N) with aerobically nitrified compost teas or inoculated substrates offers the most practical path forward.