Differences between labels and actual composition values in commercial hydroponic fertilizers

linkedinrssyoutubeinstagram
image_pdfimage_print

Whenever I am hired to duplicate a company’s fertilizer regime based on commercial products, I always emphasize that I cannot use the labels of the products as a reference because of how misleading these labels can be. A fertilizer company only needs to tell you the minimum amount of each element it guarantees there is in the product, but it does not have to tell you the exact amount. For example, a company might tell you their fertilizer is 2% N, while it is in reality 3%. If you tried to reproduce the formulation by what’s on the label you would end up with substantially less N, which would make your mix perform very differently. This is why lab analysis of the actual bottles is necessary to determine what needs to be done to reproduce the formulations.

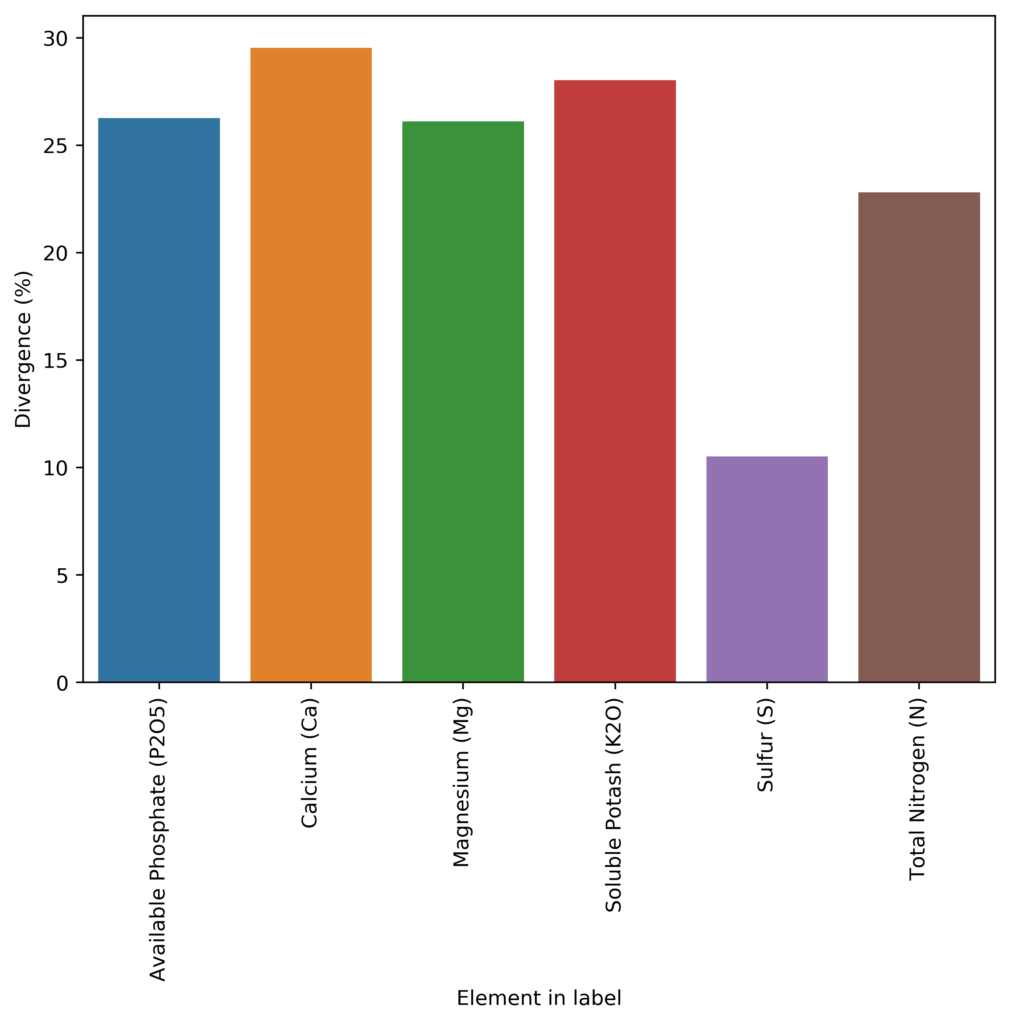
Average deviation from the reported composition on the label compared with lab analysis.

How bad is this problem though? Are companies just under-reporting by 1-5% in order to ensure they are always compliant with the minimum guaranteed amount accounting for manufacturing errors or are they underreporting substantially in order to ensure all reverse engineering attempts based on the labels fail miserably? I have a lot of information about this from my experience with customers – which is why I know the problem is pretty bad – but I am not able to publicly share any of it, as these lab tests are under non-disclosure agreements with them. However, I recently found a website from the Oregon government (see here), where they share all the chemical analysis of fertilizers they have done in the past as well as whatever is claimed on labels.

The Oregon database is available in pdf form, reason why I had to develop a couple of custom programming tools to process all the information and put it into a readable database. So far I have only processed the fertilizers that were registered in 2015, but I am going to process all the fertilizers available in their database up until 2018 (the last year when this report was uploaded). However, you can already see patterns emerging for just the 2015 data. That year there were 245 fertilizers tested, from which 213 contained N, P, K, Ca, S or Mg. If we compare the lab results for these elements with the results from the lab analysis, we can calculate the average deviation for them, which you can see above. As you can see, companies will include, on average, 20%+ of what the labels say they contain. This is way more of a deviation than what you would expect to cover manufacturing variations (which are expected to be <10% in a well-designed process) so this is definitely an effort to prevent reverse engineering.

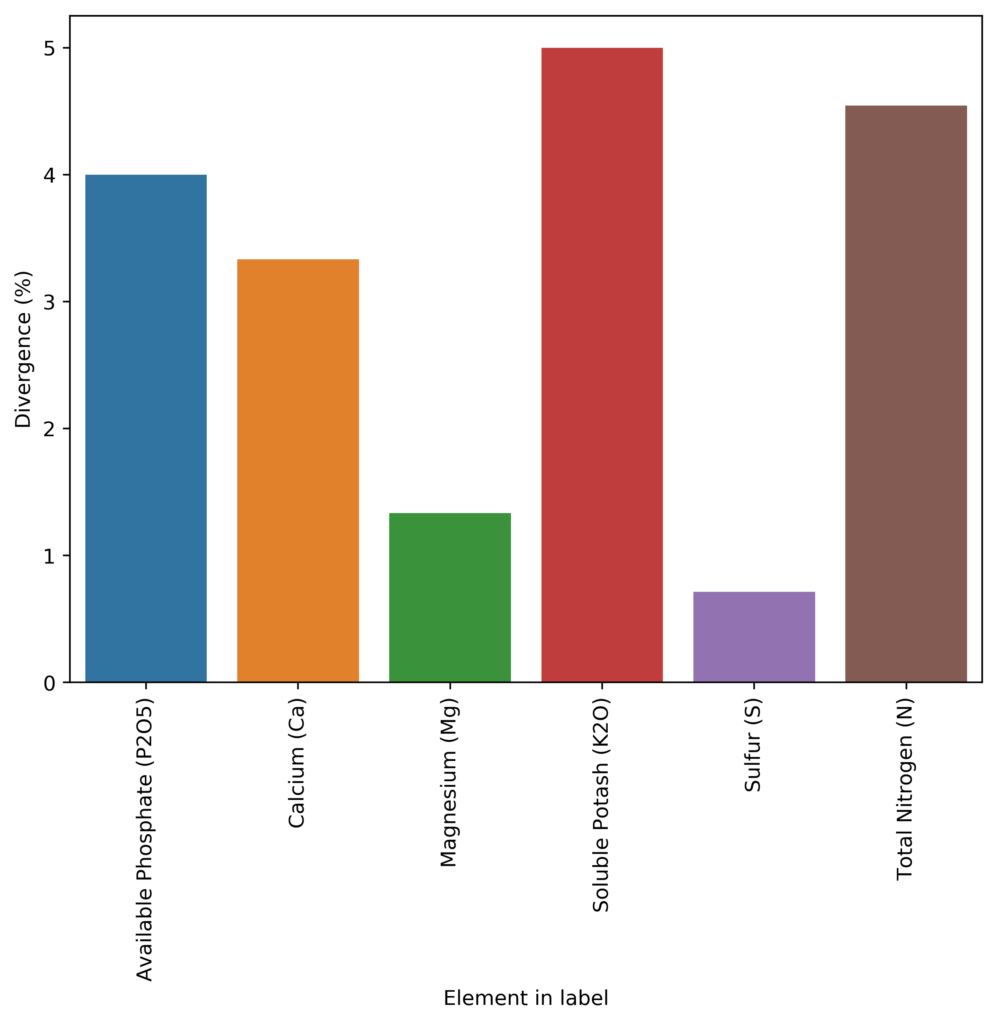
Median divergence between compositions derived from labels and lab analyses.
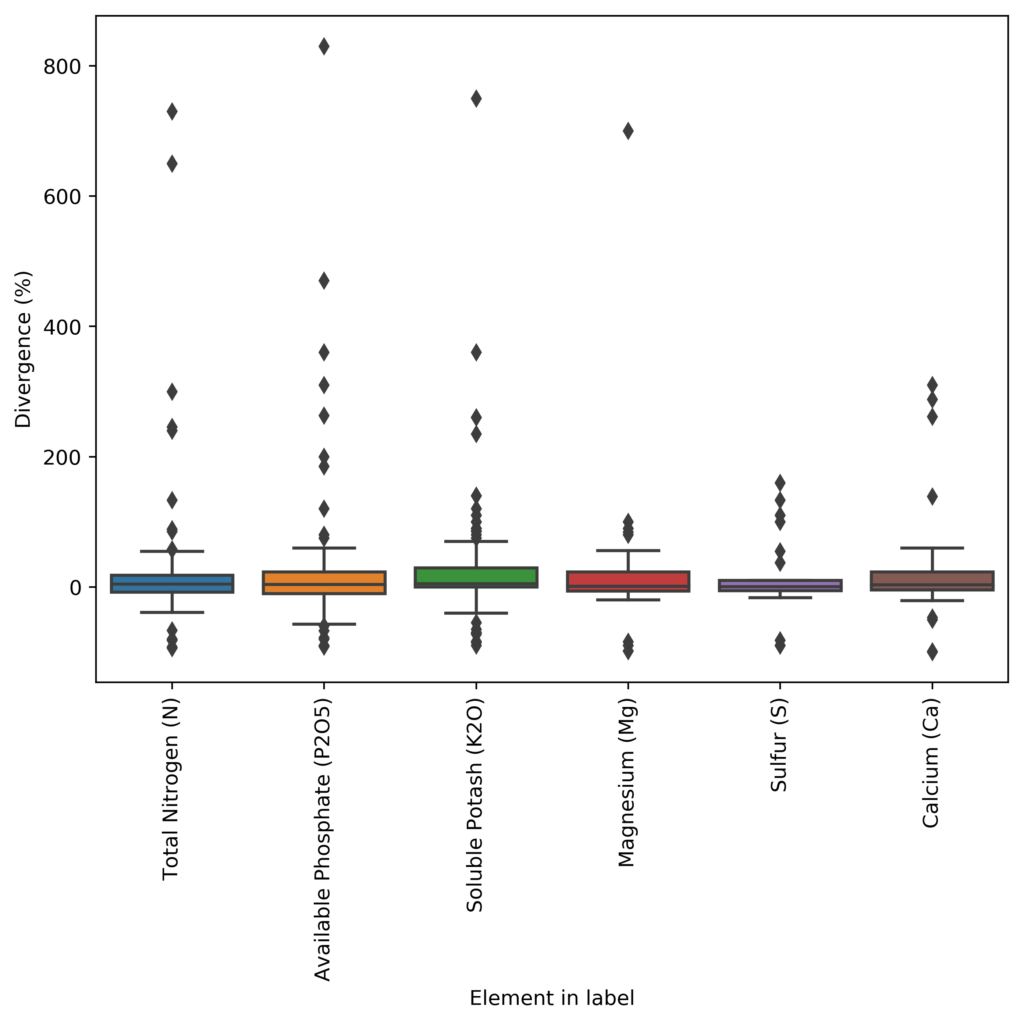
Boxplot of the divergences between compositions derived from labels and lab analyses.

Furthermore, the deviations are by no means homogeneous in the database. The above graphs showing the box plot and median deviation values, show us that most people will actually be deviated by less than 5% from their label requirements, but others will be very largely deviated, with errors that can be in the 100%+ deviation from their reported concentration. In many cases, companies also have negative deviations, which implies that the variance of their manufacturing process was either unaccounted for or there was a big issue in the manufacturing process (for example they forgot to add the chemical containing the element). These people would be in violation of the guaranteed analysis rules and would be fined and their product registrations could be removed.

With this information, we can say that most people try to report things within what would be considered reasonable if the label is to remain accurate (deviations in the 1-5% range) to account for their manufacturing issues but many companies will choose to drift heavily for this and report values that are completely misleading relative to the labels. These companies are often the ones that are most widely used as they are the ones who want to protect themselves from reverse engineering most aggressively.

Take for example General Hydroponics (GH). Their FloraGro product is registered with an available phosphate of 1%, while the actual value in the product is 1.3%, this is a 30% deviation, far above the median of the industry. They will also not just underreport everything by the same amount – because then your formulation would perfectly match when you matched their target EC – but they will heavily underreport some elements and be accurate for others. In this same Floragro product, the K2O is labeled as 6% and the lab analysis is 5.9%, meaning that they reported the value of K pretty accurately. However, by underreporting some but not others, they guarantee that you will skew your elemental ratios by a big margin if you try to reverse engineer the label, which will make your nutrients work very differently compared to their bottles.

As you can see, you just cannot trust fertilizer labels. Although most of the smaller companies will seek to provide accurate labels within what is possible due to manufacturing differences, big companies will often engineer their reporting to make it as hard as possible for reverse engineering of the labels to be an effective tactic to copy them. If you want to ever copy a commercial nutrient formulation, make sure you perform a lab analysis so that you know what you will be copying and never, ever, rely solely on the labels. I will continue working on this dataset, adding the remaining fertilizers, and I will expand my analyses to include micronutrients, which are covered by Oregon government tests.

Facebooktwitterredditpinterestlinkedin

12 Comments

  • Tyson
    February 28, 2021 @ 5:33 pm

    Great info Daniel. Thanks. I’ve stumbled across tht Oregon database in the past but men’s to go check it out more thoroughly now.

    I am sure that this question has come up many times before, but have you considered revamping Hydro Buddy a bit and releasing it for sale instead of free?
    In particular it would be very popular if it was available as a phone app. I don’t normally use my PC. In fact HB is really my main use for it and I only dragged it out of hiding a couple years ago specifically for downloading and using Hydro Buddy.

    I see there are HB copycats popping up now and then in the App Store. I have bought a few of them in the hopes of finding something I can use, but so far have not had any joy.

    I would much rather see Hydro Buddy available as an app.
    But I do believe it needs to have some of the minor quirks taken out of it first.

    • admin
      March 1, 2021 @ 6:18 am

      Thanks for commenting Tyson! Please share with me any bugs/quirks so that I can improve the software. About a phone release, it is definitely a good idea!

      • Tyson
        March 4, 2021 @ 11:09 pm

        Thanks. Yes I will sit down sometime and make a list of my general impressions. I am no app designer, just a humble user and fan. But there are definitely a few queer things about HB that make it difficult for the first time user. And I can easily think of improvements- some of which seem like they’d be quite easy to implement.

        • admin
          March 5, 2021 @ 7:46 am

          Thanks for your reply. I’m always open to suggestions that might improve the software, please send me a message through the contact page with all your suggestions when you have the time!

      • Tyson
        March 16, 2021 @ 9:11 pm

        As I mentioned on one of your other articles- I wrote out some thoughts about Hydro Buddy after using it for the last year. I can paste them in here if you prefer, or if you have an email address you can email to me then I will be able to include a couple example photos.

        • admin
          March 17, 2021 @ 7:32 am

          Thanks for writing Tyson, I have already replied to your contact request. Please send me your observations via email.

  • wendal
    March 1, 2021 @ 12:42 pm

    Super glad people are starting to realize this and that you are getting this info out there. I’m curious if batches of the same brand and product have variation as well. Have you considered testing different batches to see this?

    • admin
      March 1, 2021 @ 7:10 pm

      Thanks for commenting! In liquid fertilizers the concentrated solutions are homogeneous, so all bottles from the same batch will have the exact same composition (a neat guarantee of the fact that you’re working with solutions). However, different batches will have differences in composition due to the errors inherent to the weights and volumes measured in the preparation, these errors are normally below 5% in a well developed process.

      There are nonetheless cases, like solid fertilizer blends, where the homogenization is not guaranteed, so different bags from the same batch will have different composition. In some cases these errors can be really big, for example a fertilizer that contains 1% Fe will have a hard time dispersing that Fe among the 99% of the rest of the solid mass, so errors will tend to be very big unless the process has been carefully designed. This is why solid fertilizer blended products can often have substantial errors in their composition, even across bags from the exact same batch.

  • Jahnavi
    March 8, 2021 @ 10:42 am

    Does this deviation apply even to raw fertilizers like Calcium Nitrate , Potassium Nitrate, MKP, etc.?

    • admin
      March 8, 2021 @ 12:49 pm

      These will also under-report by a little bit, to be safe from manufacturing variance, but usually it will be quite low (<5%).

  • John McGee III
    March 17, 2021 @ 1:43 pm

    Can the same assumption be made for slow release granular fertilizers? I guess for hobbies this is not a critical issue.

    • admin
      March 17, 2021 @ 1:49 pm

      Usually companies that produce blended fertilizers intended for traditional agriculture that are solids – like the slow release granular fertilizers you refer to – aren’t too afraid of reverse engineering, so they will just under report to cover the manufacturing variance (so they’ll underreport by around 5%) which is normal and not very consequential for their intended use. Divergences between lab measured and label values are most dramatic for blended fertilizers sold for their use in hydroponics.

Leave a Reply to Tyson Cancel reply

Your email address will not be published. Required fields are marked *

Subscribe Today!
Receive our FREE blog post updates and monthly newsletter
Thanks for signing up. You must confirm your email address before we can send you. Please check your email and follow the instructions.
We respect your privacy. Your information is safe and will never be shared.
Don't miss out. Subscribe today.
×
×
WordPress Popup Plugin