Building a model to predict EC in hydroponic nutrient solutions

linkedinrssyoutubeinstagram
image_pdfimage_print

Electrical conductivity (EC) is one of the most useful parameters in the practical preparation of hydroponic nutrient solutions. This is because knowing the expected conductivity of a nutrient solution can allow you to prepare solutions without having to measure the total volume exactly, a parameter that is often hard to accurately determine in practice. Although determining the target conductivity is easy to do using small preparation volumes – which can be done accurately – it is often impractical to do so routinely, which is necessary if the actual composition of the nutrient solution is being changed as a function of time. Due to all the above, it is important to come up with accurate models to estimate the EC of nutrient solutions with only information about their mineral composition, without having to measure the value experimentally. In this post I am going to talk about how I created a model to do exactly this, taking advantage of multi-variable experimentation and simple modeling techniques.

Mineral nutrient concentrations (ppm) of all the samples measured

The problem with conductivity modeling is that not all salts contribute the same to the conductivity of a nutrient solution. For example potassium sulfate can contribute significantly more to conductivity per gram compared to a salt like monopotassium phosphate. Furthermore, the addition of some salts can affect the conductivity of others (see my previous post on conductivity modeling in Hydrobuddy for more details). In the regime we use in hydroponics, the determination of electrical conductivity using data from limiting molar conductivity can lead to very skewed results, which makes these estimations of little usage in practice.

To solve this issue, I designed an experiment where 50 different EC measurements were made for different hydroponic nutrient solutions within the range of concentrations of nutrients that are reasonably expected in hydroponic culture, with some values being above these in order to ensure that all values encountered in practice will be within the measured ranges. The image above shows you all the concentrations that were measured within the experiment. To prepare the solutions I used calcium ammonium nitrate, potassium sulfate, magnesium sulfate heptahydrate, monopotassium phosphate and ammonium sulfate. All of these were agricultural grade salts in order to reflect the same impurities expected in a normal hydroponic setup. Note that no heavy metal salts were used since their contribution to the EC of a hydroponic nutrient solution is negligible.

Concentrated solutions of all the salts were prepared in 250mL volumetric flasks using a +/-0.001g scale and aliquots of these solutions were drawn using 5mL plastic syringes (+/- 5%) in order to prepare final 250mL solutions using volumetric flasks. Conductivity measurements were done using an Apera EC60 conductivity meter that was previously calibrated using a 2 point calibration method. All the solutions were prepared using distilled water. The target concentrations for the solutions were determined using a pseudo random number generator in order to try to ensure a random distribution of samples within the concentration space of interest.
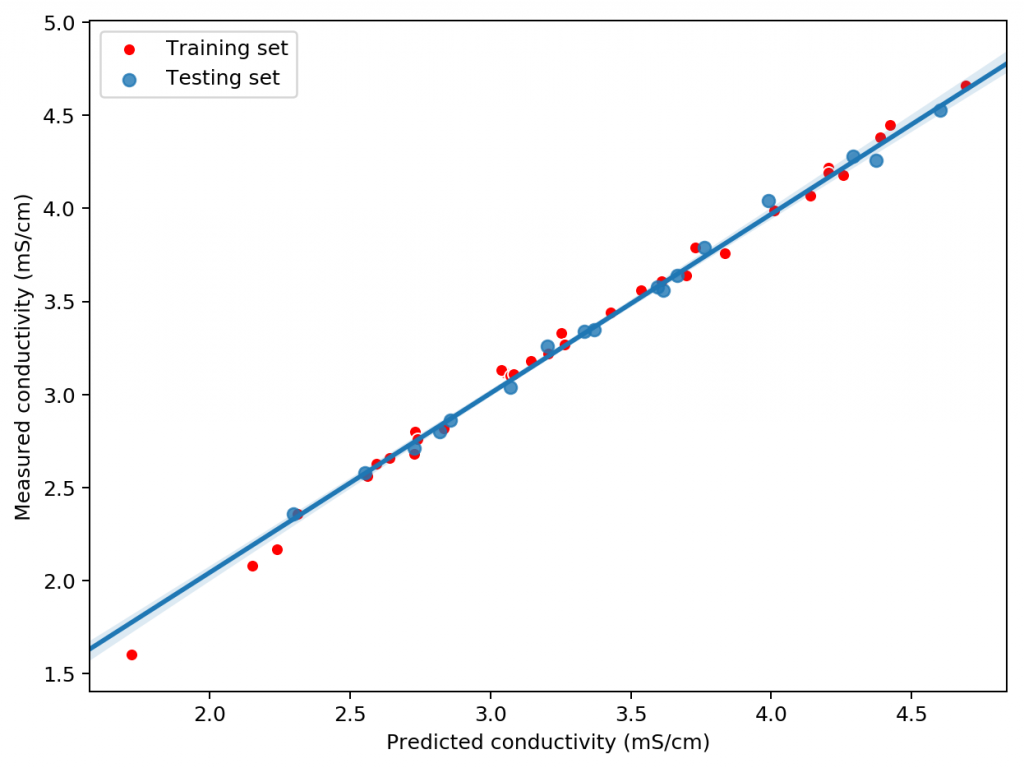
A sample modeling results for a random split with training (33 data points) and testing sets (17 data points)

Using this data we constructed a linear model to attempt to predict conductivity. In order to evaluate the model we randomly split the results to get 33 data points used for model construction and 17 points left for model validation. Performing this process 100 times shows that the mean R2 of the model on the training set is 0.995 while the average on the training set is 0.994. This shows that the model is able to properly generalize the conductivity data in order to properly predict the conductivity of the solution across the space studied. The mean absolute error in the testing set was 0.036 mS/cm. This shows the high certainty with which we can make conductivity predictions.

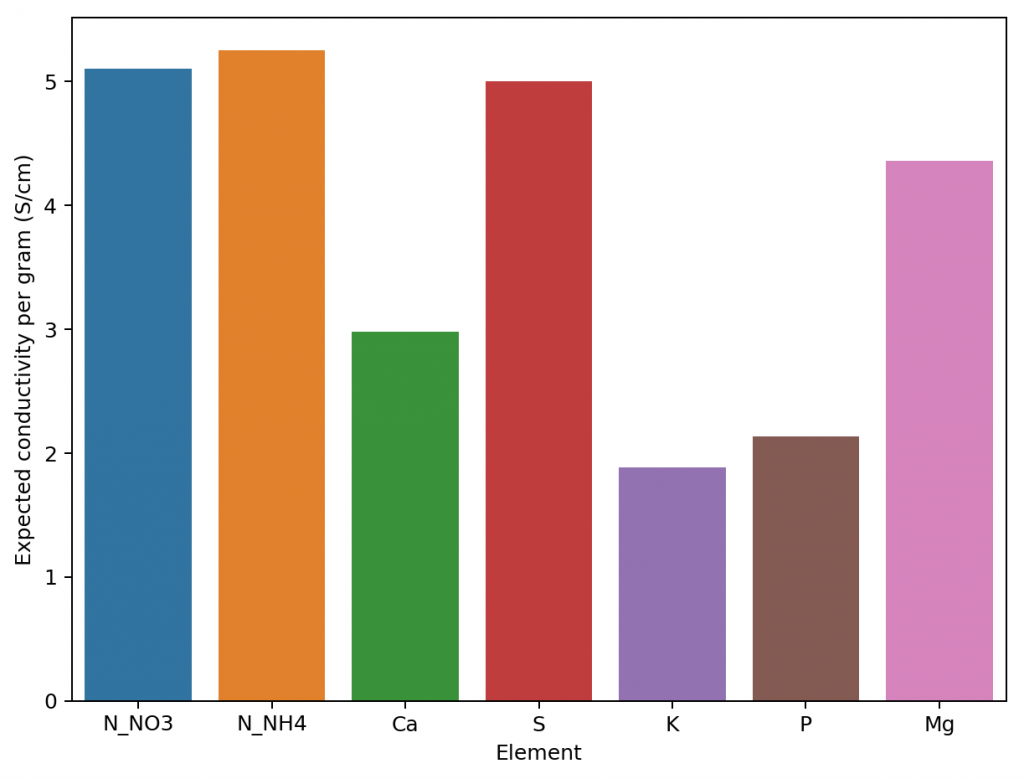
Exploring the model coefficients can also show us how different the contributions of the different elements to the conductivity of the nutrient solution can actually be. These results are surprising if you compare them to the conductivity contributions per gram that are expected from the limiting molar conductivity values, which are the conductivity values the ions exhibit on their own under very high dilutions (this is also the method used in HydroBuddy <=v1.65). We can clearly see here that in reality we are getting way more conductivity out of sulfate compared to the other elements and significantly less from magnesium. This means that at the makeup and concentration values used in hydroponics the Mg ions are not being able to contribute as much as they can when they are alone because their activity is being lowered by the other ions in solution, while the opposite case applies to sulfate.
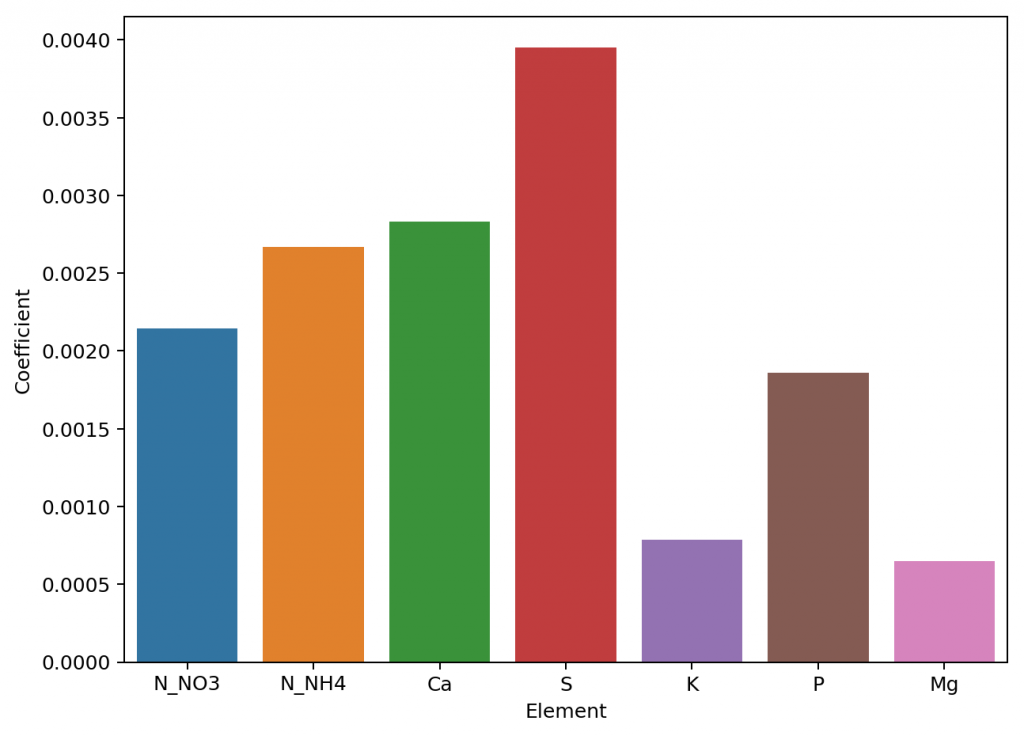
Linear model coefficients for the different elements (proxy for their contribution to conductivity)
Expected conductivity values per gram using data from limiting molar conductivity values (taken from here)

The above shows us why conductivity in hydroponics is so complicated, it shows how ions do not contribute equally to conductivity and how they behave very differently in real hydroponic solutions. Thankfully the above also shows how we can create a model using experimental data that is actually able to predict conductivity, since the relationships – although different than expected – are still highly predictable when enough experimental data is available. All the above experimentation took 4 hours to do – with the help of my lovely wife, who is also a chemist – and should allow me to add a very powerful model to predict hydroponic nutrient solution EC values to HydroBuddy.

All the above experimentation data will be open source and available in a github repository soon. We also hope to show you how all of this was done in a youtube video in the near future.

Facebooktwitterredditpinterestlinkedin

10 Comments

  • […] my previous post you can read about how I ran experiments to develop a conductivity model using empirical data in […]

  • Jeff
    August 8, 2020 @ 12:50 pm

    Great work!

  • […] Empirical model for the prediction of EC (new in v1.8)(read more here) […]

  • Matthew Baker
    August 12, 2020 @ 11:51 am

    That’s really cool! I wonder why the empirical model is so different from the published values. In the spirit of peer review I offer the following enhancement to your experiment: record the pH of the solution and determine how H+ concentration impacts your model. I say this because H+ is already involved via the monopotassium phosphate, and H+ ofc both conducts electricity and might inhibit/enhance the EC of other species.

    Maybe performing your experimental series a number of times with different acids at different concentrations (keep acid conc. as independent variable and see how the EC contributions change?) would tell us more. If it turns out to be useful, pH could be a powerful input to your model. If you don’t do this, I very well might (if I can replicate your results first..).

    Maybe I’m mistaken. Makes me wonder how the salts in your measurement correlate with each other; do some salts ‘boost’ the EC other salts? ‘boost’ certain counterions? Where is the research on this? Why can’t I find a review article?

    I guess fancy plant researchers aren’t super interested in exactly how much information you can wring out of a 30 dollar instrument. But farmers and citizen scientists should be interested, right? Time to read your blog again and see what I’ve missed.

    Thanks so much for your efforts!

    • admin
      August 13, 2020 @ 8:17 am

      Thanks for your comment! Although pH is a factor – because H+ ions are highly conductive – the concentration of H+ at the most acidic pH we’re bound to get here (which is close to 5) is actually only 1×10^-5M, so even without accounting for it, it is unlikely to affect the EC measurement by more than a couple of percent points at most. You will see that most of the research centered around predicting EC values in this context pays virtually no attention to pH due to this reason.

      About salts affecting each other’s conductivity values. They almost never “enhance” but routinely diminish each others conductivity by affecting a property called the “activity” of the ions. Ions that are present in very dilute solutions – where they can be considered to never interact with other ions – will have an activity of 1, while as a solution becomes more concentrated and the probability of ions interacting with others increases, the activity will drop significantly below this value. In very concentrated solutions, the activity might be a tiny fraction of 1. This is because ions are no longer technically dissolved in “pure water” but now in a media that contains a lot of things that are not water, that change the properties of the environment. If you search for “electrical conductivity” and “activity” you will find a lot of papers on this subject.

      Also, fancy plant researchers are interested in this topic! Mainly because in commercial hydroponic setups being able to make EC predictions and adjust formulations is also a very valuable tool. There are several papers about the prediction of conductivity in hydroponic solutions, however none of them share their actual data, reason why I couldn’t use them to enhance my modeling. Thanks again for writing!

  • Bill
    August 13, 2020 @ 7:59 pm

    My mother always said I would have to learn to read sometime. I looked for the Windows HydroBuddy last Saturday. Several days later I asked when version 1.8 would come out and it was already out.

    If you look at the formulas you include in HydroBuddy – in particular those for lettuce, strawberries and tomatoes, in general the amount of sulfur (ppm) is rather small – less than 100 ppm usually around 50 ppm. I have also looked into formula suggested online – a combination of MasterBlend 4-18-38 with Epsom Salts and Calcium Nitrate – and it fits into the group with a sulfur level around 50 ppm. When I make up these formulas it is necessary to minimize sulfur. In fact, when I use my local tap water (reported sulfur level of 46 ppm) I have to use magnesium nitrate rather than epsom salts to keep the sulfur level down.

    All this was to indicate that perhaps your use of sulfur compounds in your experiment may not have been appropriate for some of the hobby formulas. The calculated EC values are astoundingly off unless significant sulfur is added – making sulfur level close to or greater than 100 ppm. By astounding I mean numbers like -14.0 for a solution that has an EC of +1.6 for H. Resh Lettuce 2 formula. I’m sure it’s because the I made formula using only nitrates – the only sulfur is from the tap water and, frankly, may be zero to up to 75 ppm – I only have an annual average number from the water company of 46 ppm. This makes sense – in your experiments sulfur had very large effect on EC so formulas without any significant sulfur should be the most inaccurate.

    Interestingly enough, the LMC model provides a fairly close estimate. In fact, if you take the LMC model and divide by 0.66 and multiply by 0.8 you will get a very close estimate.

    I am saying all this in order to put my vote in for the next set of experiments to be mostly nitrate driven – Mono-ammonium Phosphate, Potassium Nitrate, Calcium Nitrate and Magnesium Nitrate in particular. Six variables (NO3, NH4, P, K, CA and Mg) with two levels and a partial factorial design shouldn’t be too difficult – less than 100 tests depending on the replication level you want. Your model apparently only uses main effects of the elements and produces a linear result suggesting there are no interactions. Not sure I would want to ignore interactions though – the out-sized effect of sulfur indicates that it creates an interaction with many of the other elements.

    • admin
      August 14, 2020 @ 7:48 am

      Thanks for your comment! The reason why I chose mainly sulfates for the empirical model is precisely because the LMC model already provides pretty good results for solutions that are built around nitrates but fails pretty dramatically when using mainly sulfates for nutrient solutions. Bear in mind that many commercial growers as well as commercially sold nutrient formulations, use significantly high amounts of sulfur (in the 150-250 ppm range), this is quite common when large flowering plants are grown and potassium sulfate is used to get K in the 300-400 ppm range. High amounts of sulfur do not affect plant growth in a negative way, many plants can handle sulfur concentrations in the 200-400 ppm range without showing problems.

      Another point is that a linear relationship between concentration and EC does not mean there are no interactions! It only means that the interactions, if present, are linear in nature. If you compare the slopes of the linear regressions of conductivity values measured as a function of concentration of solutions prepared with single salts compared with those of mixed salts, you’ll notice that the slope values are different, so interactions are definitely present.

      These experiments are quite demanding in terms of time and effort, especially to make sure they are done carefully and accurately, so if the LMC model works well for other solutions we are unlikely to go through the effort to build another empirical model, mostly because it seems unnecessary if a model that works well enough already exists.

      I definitely appreciate your inputs so do let me know if you have other questions about our models!

      • Bill
        August 14, 2020 @ 8:27 pm

        Actually, in a previous blog post about EC you said the LMC model was adjusted in HydroBuddy by multiplying by 0.66 (0.6? I don’t remember) and you said that was because it was a relatively arbitrary correction. My recollection was you said that a correction may not be as needed if most of the EC came from nitrates – which agrees with my experience and was why I just took the HydroBuddy LMC value and boosted it (divide by 0.66 and multiply by 0.8).

        So I’ll use the LMC value for an estimate for any formula modifications – also if I want to dilute a formula (say for seedlings) to reduce EC the LMC method can provide guidance. Can’t just dilute because I’m using tap water – makes HydroBuddy essential. Life is so much better with HydroBuddy – thanks.

        Relative to the interaction comment – I agree completely. In fact, it appears to me that the reason the experimental method works so well is that sulfur has a significant interaction with most of the cations present. I took a lot of chemistry when I was in college – but that was 50 years ago so figuring out why is not in the stars for me. Probably has something to do with equilibrium constants with the cations – high interactions are indicated for calcium and ammonium too – so it gets really complex. Interesting for a chemist, not for a retired hobbyist though.

  • Filippos
    October 1, 2020 @ 2:55 am

    Hi Daniel,

    I have been following your work for the last 5 years and I want to congratulate you and thank you very much for the awesomeness you bring forward and share with us.

    I have a question as I would like to use these data in my custom Hydroponic XLS calculator.
    How can I use the coefficient to simulate conductivity in mS/cm?
    Is this coefficient in grams per ml? grams per liter? grams per ton?
    And what would be the unit of conductivity contribution for this coefficient (e.g. mS/cm or microS/cm etc)

  • Filippos
    October 1, 2020 @ 3:47 am

    Ah!
    One more question

    Carbonates and bicarbonates and carbonate salts can be really confusing. I am still trying to wrap my head around the topic.
    I wonder if any of the above would contribute significantly to electric conductivity which would make sense?

Leave a Reply to admin Cancel reply

Your email address will not be published. Required fields are marked *

Subscribe Today!
Receive our FREE blog post updates and monthly newsletter
Thanks for signing up. You must confirm your email address before we can send you. Please check your email and follow the instructions.
We respect your privacy. Your information is safe and will never be shared.
Don't miss out. Subscribe today.
×
×
WordPress Popup Plugin